📊 MARKET OVERVIEW
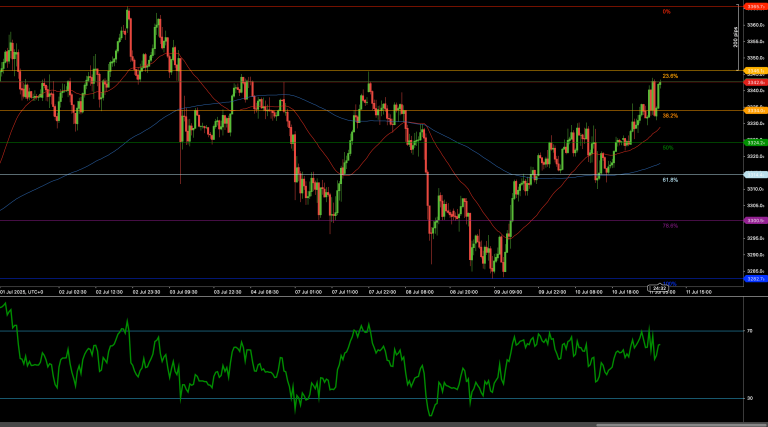
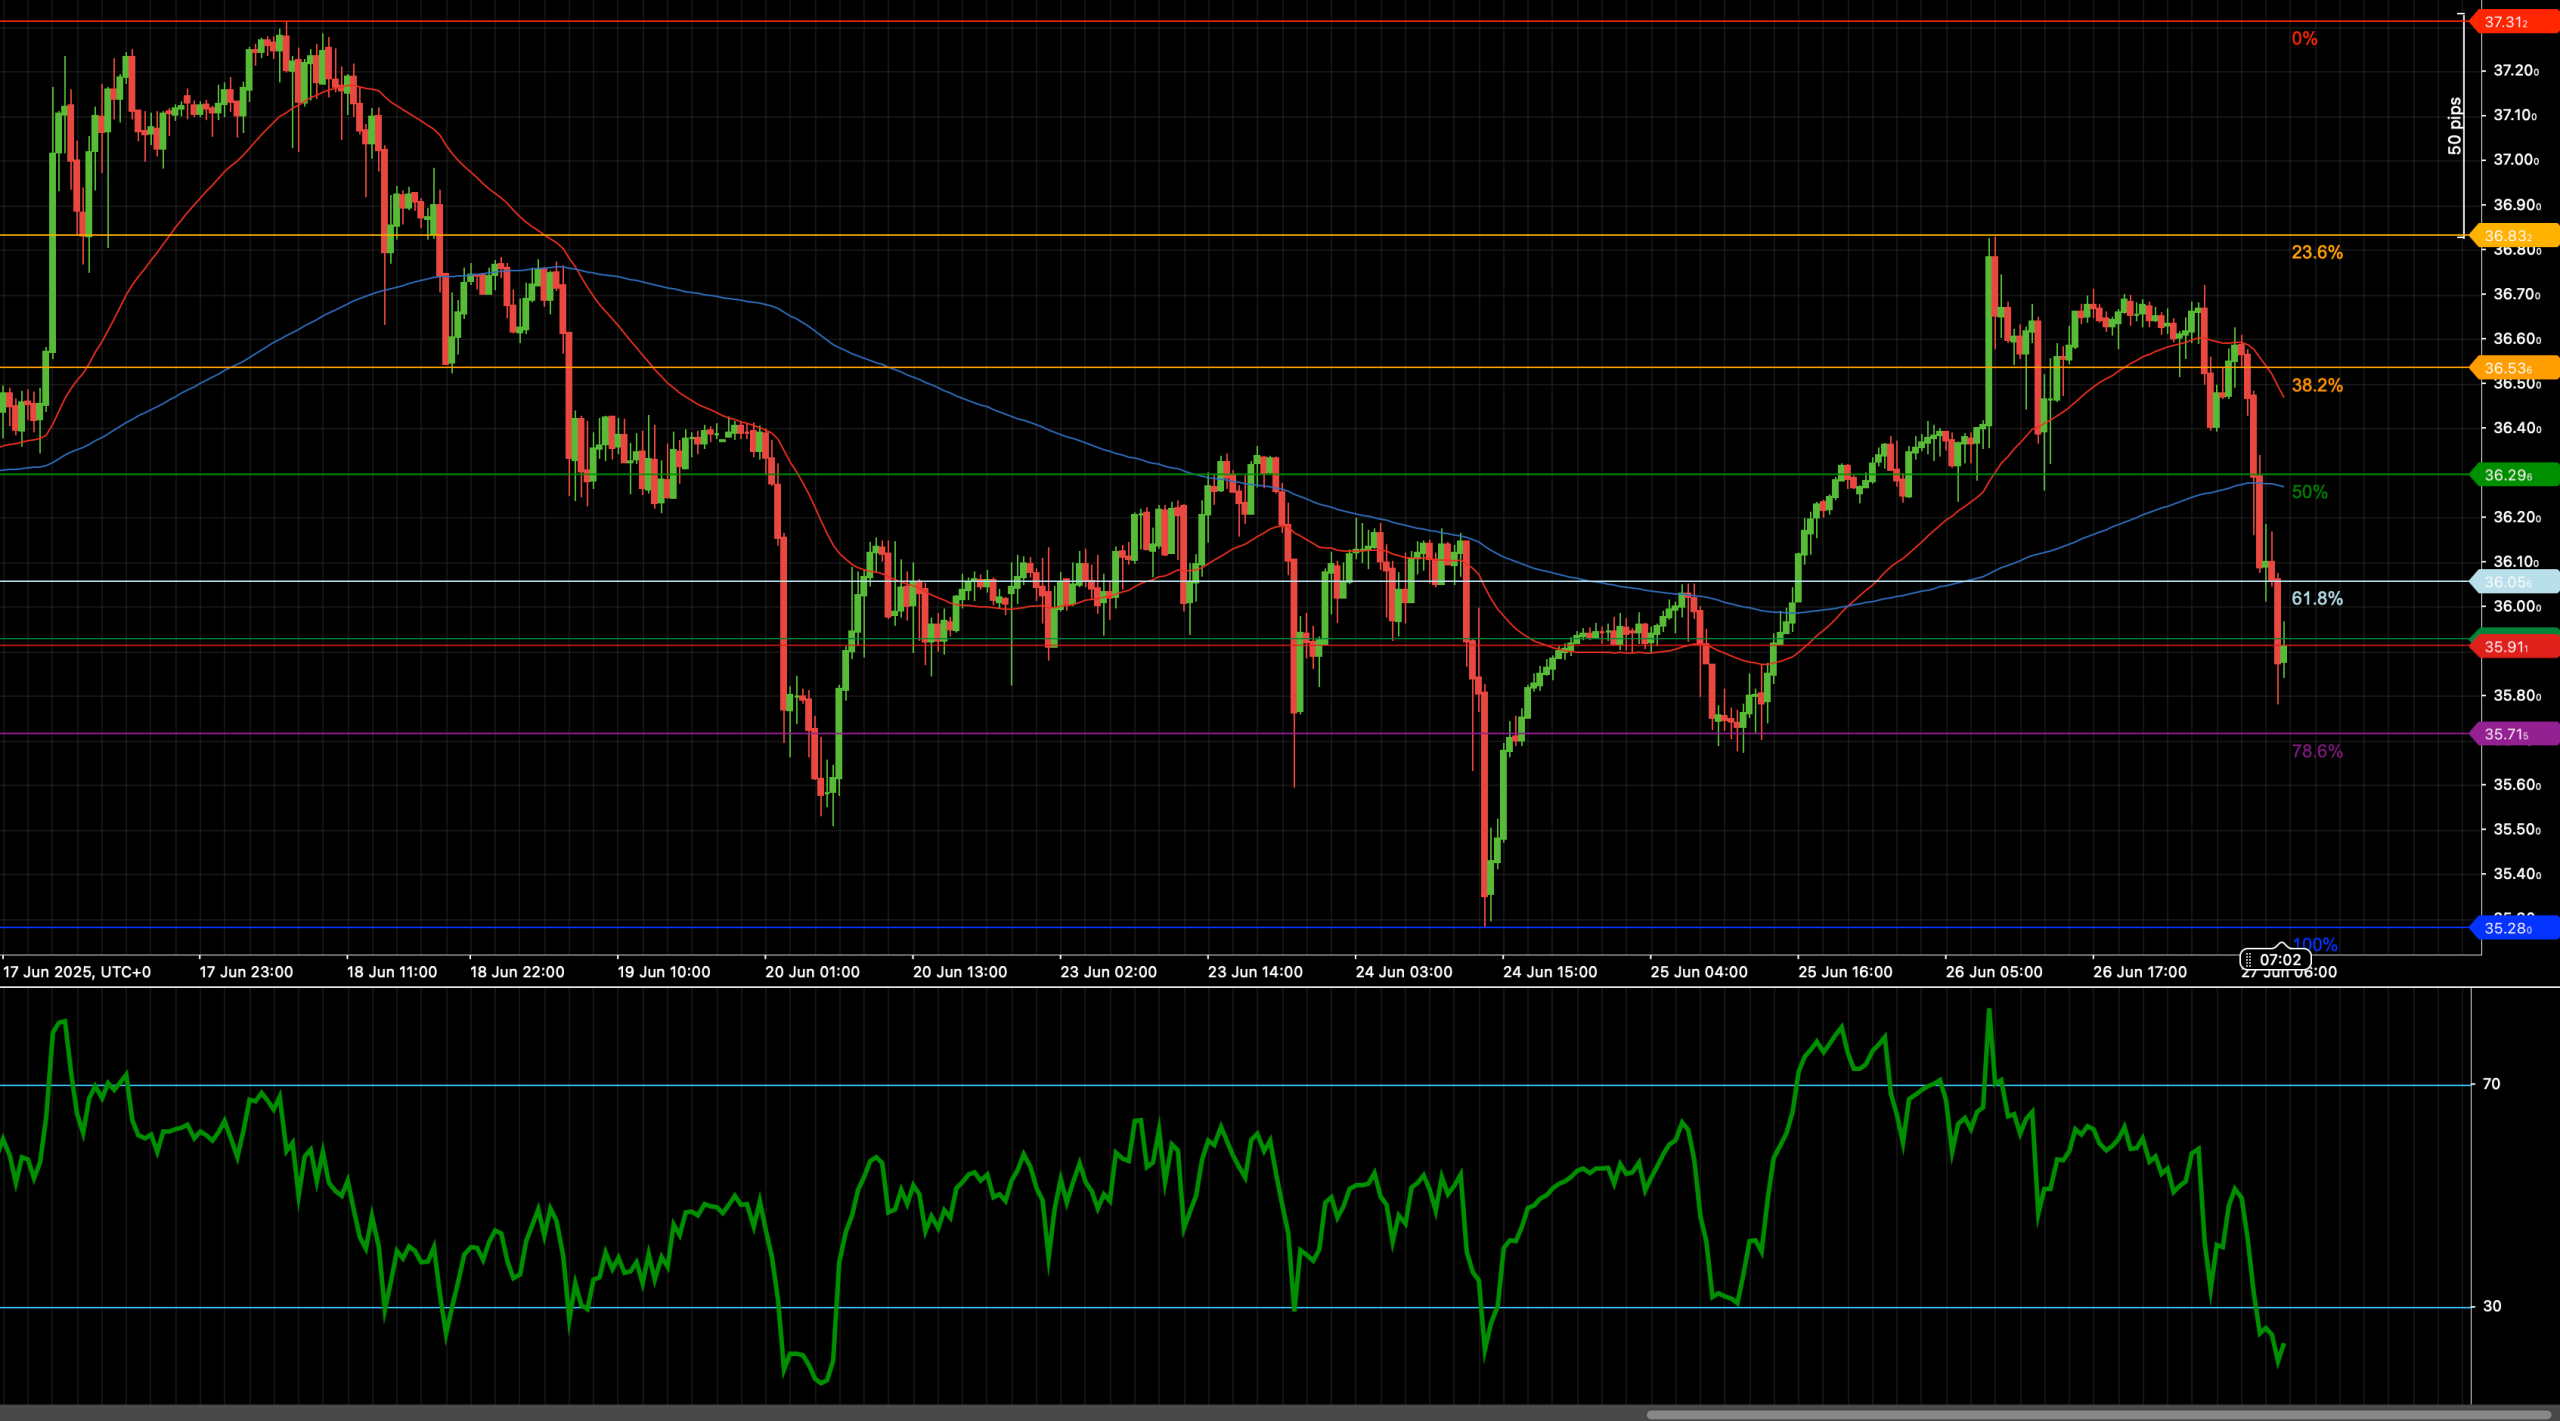
Silver (XAG/USD) is under pressure after breaching the 61.8% Fibonacci retracement of the June rally, positioned near 36.00. This breakdown reflects a shift in momentum following multiple failed attempts to reclaim higher ground near 36.70. The weakness appears consistent with broader metal sector softness and rising dollar strength, pressuring commodities.
From a fundamental perspective, expectations around global interest rate paths and sticky inflation continue to weigh on precious metals. Silver’s inability to hold above key dynamic levels suggests buyers are stepping aside. Price action remains reactive to macro shifts, but the current setup implies technicals are now taking the lead in short-term directional flows.
📈 TECHNICAL ANALYSIS
Key Support and Resistance Levels
The breakdown below the 61.8% Fibonacci retracement at 36.00 has exposed the next critical support at 35.71 – the 78.6% retracement of the June rebound. This zone could act as a temporary floor, but if selling persists, the next level to watch is 35.28, representing a full retracement of the recent up leg. On the upside, immediate resistance lies at 36.35, followed by 36.55 and 36.90, where previous reactions occurred.
Moving Averages and Dynamic Price Action
XAG/USD has fallen below both the 50- and 200-period weighted moving averages, which now converge near 36.35. These levels act as dynamic resistance and align with structural rejection zones from earlier in the week. The slope of both moving averages is pointing downward, confirming bearish momentum and trend deterioration.
RSI Momentum and Bearish Tilt
The 14-period RSI has dropped beneath 40, reinforcing the bearish sentiment in the market. This move signals increasing downside momentum and lack of bullish participation. Unless RSI can recover toward 50 or break back above 55, price is likely to remain heavy. Watch for potential RSI divergence as a sign of exhaustion, though none is evident yet.
Candlestick Behavior and Price Action Clarity
The recent candlestick sequence shows large-bodied bearish candles breaking through support, confirming strong seller conviction. Previous bounce attempts lacked follow-through, and each lower high established reinforces a descending structure. To signal a potential reversal, the market would need a bullish engulfing pattern or pin bar at key support – neither of which has yet appeared.
Chart Structure and Trend Formation
Structurally, the chart displays a breakdown from a minor topping pattern, with clear lower highs and lower lows forming. This aligns with a bearish trend development, targeting deeper Fibonacci zones. If 35.71 fails, bears may aim for full measured move completion toward 35.28 or even an extension toward 35.00 if volume increases.
Fibonacci Retracement and Extension Levels
The Fibonacci framework from 37.31 (June high) to 35.28 (recent swing low) highlights the 61.8% level at 36.00 – now broken – as a failed support. Current trading around 35.85 targets the 78.6% retracement at 35.71, and completion of the 100% move at 35.28 could follow. On the rebound side, 36.35 (resistance) aligns with the 50-WMA and acts as the upside trigger for bullish recovery potential.
🔍 MARKET OUTLOOK & TRADING SCENARIOS
Bullish Scenario
A bounce from 35.71 with RSI reversal above 50 and bullish candle confirmation could trigger a move toward 36.35 and possibly 36.55. Buyers would need to close above the 200-WMA to reinforce bullish conviction.
Neutral Scenario
Sideways movement between 35.71 and 36.35 could develop if buyers step in near support but lack breakout power. Range-bound strategies might apply here, with RSI oscillating between 40 and 55.
Bearish Scenario
A close below 35.71 and RSI under 35 would open the door toward 35.28 and deeper correction levels. Momentum confirmation with impulsive candles and increased volume would favor continued selling.
💼 TRADING CONSIDERATIONS
Bullish setup: Buy rebound from 35.71 with targets at 36.35 and 36.55; stop-loss below 35.28
Bearish setup: Sell breakdown below 35.71 aiming for 35.28 and 35.00; stop-loss above 36.35
Range strategy: Consider short-term bounces or fades between 35.71–36.35 using RSI pivots and candlestick signals
🏁 CONCLUSION
Silver’s break below 36.00 marks a significant shift in near-term sentiment, putting pressure on lower Fibonacci levels and invalidating the bullish structure. RSI momentum favors sellers, while moving averages point to continued pressure. Traders should focus on 35.71 and 36.35 for the next major direction clues. Until a decisive breakout or reversal emerges, the bias remains tilted to the downside.
⚠️ DISCLAIMER
This analysis is for informational purposes only and does not constitute financial advice. Always consult with a licensed financial professional before making trading decisions.