📊 MARKET OVERVIEW
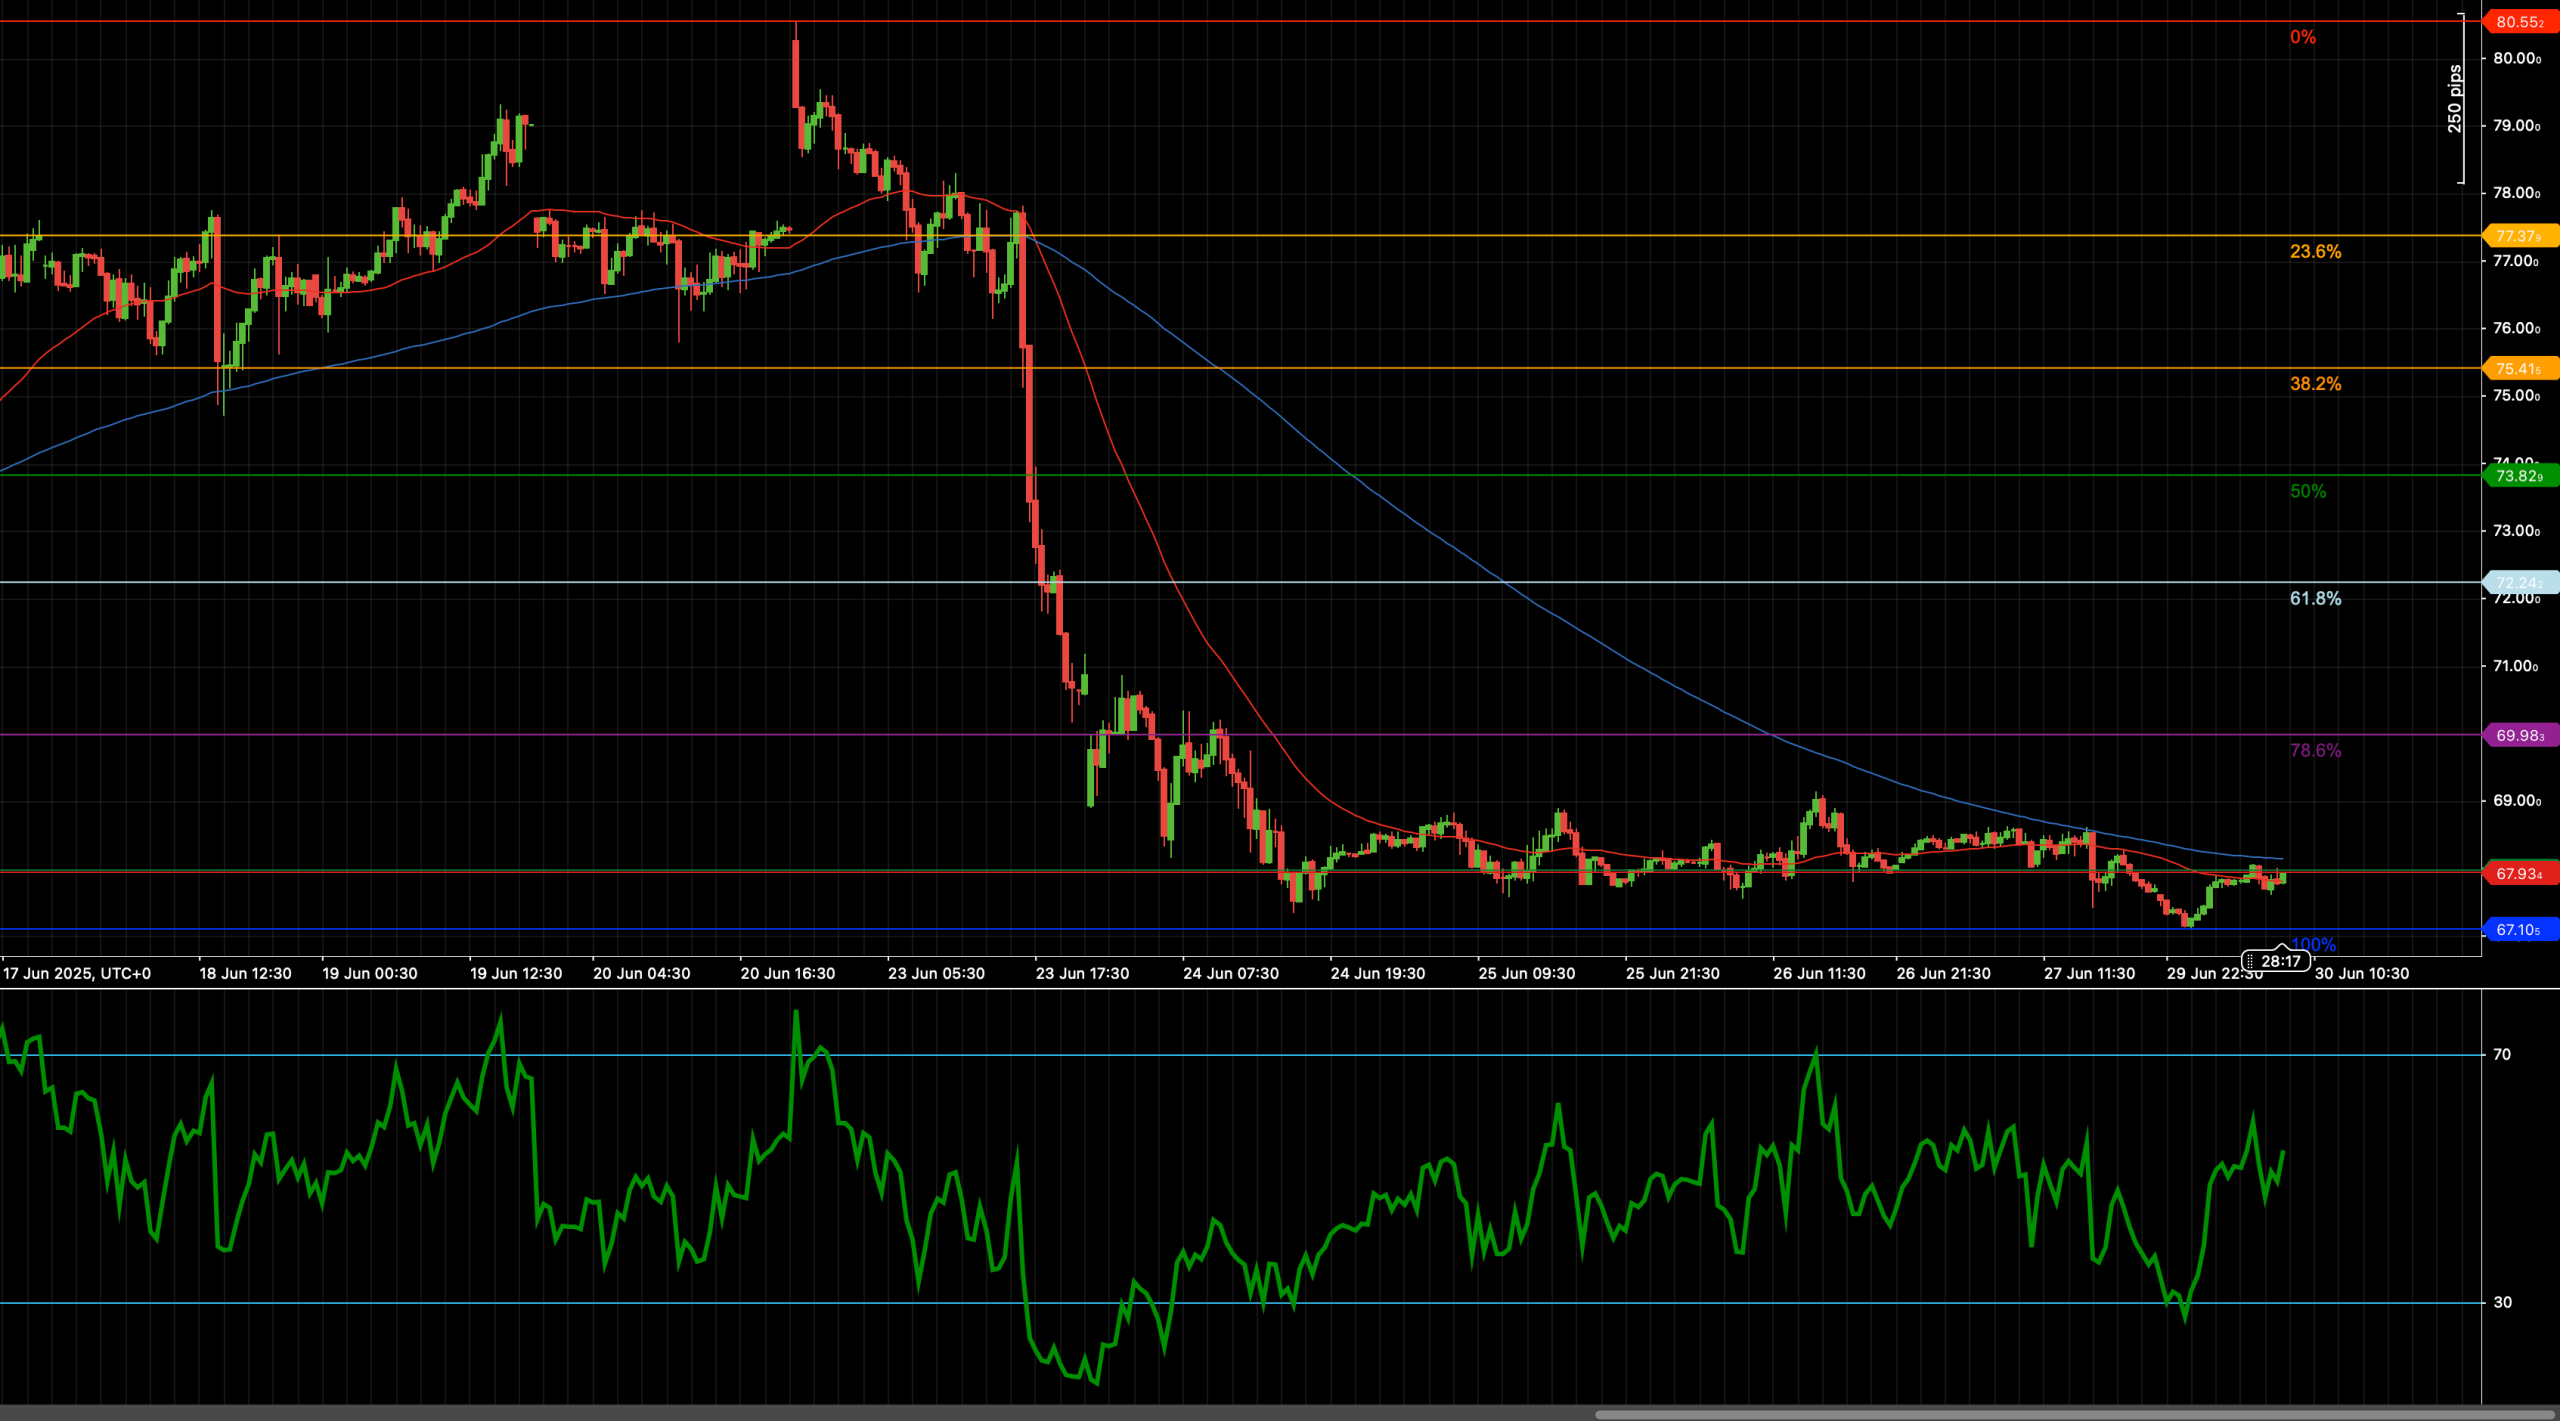
UKOIL (WTI Crude Oil) has experienced a dramatic decline, completing a full 100% retracement of its prior advance and testing the key support level at $67.10. This decline reflects a shift in sentiment driven by weakening global demand outlooks and a sharp deterioration in momentum. The psychological threshold near $67.00 has temporarily held firm, with price action now flattening into early consolidation.
The broader macro backdrop remains bearish, as markets digest poor demand signals from major importers alongside mixed supply-side news from OPEC+. While fundamentals lean bearish, the technical picture shows the first signs of bottoming following a series of heavy red candles. For now, traders are watching for structure formation and RSI stabilization as potential reversal indicators. A sustained hold above $67.10 is essential for any bullish relief rally to materialize.
📈 TECHNICAL ANALYSIS
Key Support and Resistance Levels
The main technical support lies at $67.10 — the 100% Fibonacci retracement from the $80.55 swing high to the current low. This level has acted as a temporary floor following the breakdown below the 78.6% level at $69.95. If this zone is breached again with volume, further downside opens toward $66.50 and $65.00 psychological supports. On the upside, initial resistance emerges at $67.90, which aligns with short-term swing highs. Beyond that, the 78.6% retracement at $69.95 and the round number at $70.00 represent deeper corrective targets if a rebound gains traction.
Moving Averages and Dynamic Price Action
Price is currently trading well below both the 50- and 200-period weighted moving averages, underscoring the strength of the recent bearish momentum. The 50-WMA is trending sharply downward and sits just above $69.00, while the 200-WMA has rolled over and offers dynamic resistance near $71.80. A bullish reversal would require the pair to regain and close above these moving averages, which would suggest structural recovery. Until then, the bearish control zone remains dominant, and rallies should be viewed cautiously unless supported by momentum.
RSI Momentum and Oversold Conditions
The 14-period RSI recently dipped below 30, confirming deeply oversold territory during the capitulation leg to $67.10. However, current price stabilization has been accompanied by a modest RSI rebound, which now hovers around the 35–40 zone. This signals that bearish momentum may be losing steam, but conviction is still lacking. For bulls to take over, the RSI needs to breach the 50 barrier and trend toward 60, aligning with a potential breakout above resistance levels.
Candlestick Behavior and Reversal Watch
Recent candlestick activity suggests the emergence of early bottoming behavior. After a sequence of extended bearish candles, price action has transitioned into smaller-bodied candles with lower wicks near the $67.10 base. This reflects buyer interest at these levels, though not yet forceful enough to shift the trend. A wide-bodied bullish candle closing above $67.90 would be the first concrete signal of reversal potential, particularly if backed by increased volume and RSI breakout confirmation.
Chart Structure and Accumulation Potential
The broader chart now resembles a potential accumulation pattern following a vertical drop. Price is carving out a flat base between $67.10 and $67.90, offering a possible low-risk, high-reward setup for range traders. Confirmation of accumulation would come from higher lows forming above $67.10 and a decisive breakout above the consolidation ceiling. Until then, this zone remains neutral and vulnerable to fresh breakdown if buyers do not defend the base convincingly.
Fibonacci Retracement and Extension Levels
The full Fibonacci retracement grid from $80.55 to $67.10 frames the entire move. A rebound from the 100% level would first encounter the 78.6% retracement at $69.95, followed by the 61.8% level at $72.00. These zones represent strong resistance and will be tested only if momentum builds. On the flip side, a failure to hold $67.10 opens the path to potential extensions toward $65.00 and even $62.80 — psychological and historical support levels that coincide with broader macro Fibonacci alignments.
🔍 MARKET OUTLOOK & TRADING SCENARIOS
Bullish Scenario
A clean breakout above $67.90, ideally on a bullish engulfing pattern with RSI crossing 50, would suggest the beginning of a recovery. Targets would include $69.95 and $72.00, while a strong close above the 200-WMA would shift sentiment back to neutral-to-bullish. Traders should watch for accumulation volume at the base and any momentum divergence confirmation.
Neutral Scenario
In this scenario, price remains trapped between $67.10 and $67.90 with RSI drifting sideways. This creates a low-volatility consolidation band, ideal for mean-reversion trades. Until structure shifts decisively, the range setup remains the dominant trading framework.
Bearish Scenario
Should $67.10 break decisively, momentum will likely accelerate to the downside. RSI would need to fall below 35 to confirm breakdown risk, with targets at $66.00 and $65.00. A move below $65.00 would invalidate any base-building narrative and point toward sustained bearish control.
💼 TRADING CONSIDERATIONS
- Bullish setup: Buy breakout above $67.90 targeting $69.95 and $72.00; stop-loss below $67.10
- Bearish setup: Sell breakdown below $67.10 targeting $66.00 and $65.00; stop-loss above $67.90
- Neutral strategy: Fade moves between $67.10 and $67.90 using tight stops and RSI confirmation signals
🏁 CONCLUSION
UKOIL is attempting to stabilize after an aggressive decline that completed a full 100% Fibonacci retracement to $67.10. While technicals show tentative signs of bottoming, the trend remains bearish unless price reclaims key levels like $67.90 and $69.95. Traders should remain flexible and responsive to breakout signals on either side of the current range. Until then, this remains a high-stakes inflection zone offering both risk and opportunity.
⚠️ DISCLAIMER
This analysis is for informational purposes only and does not constitute investment advice. Always conduct your own research and consult with a professional financial advisor before making trading decisions.