📊 Market Overview
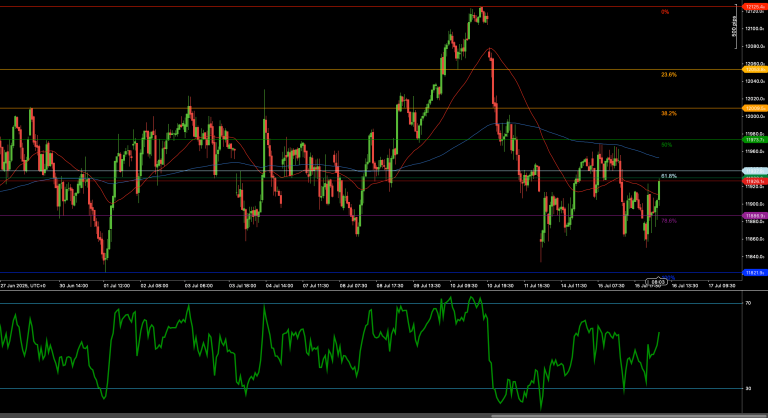
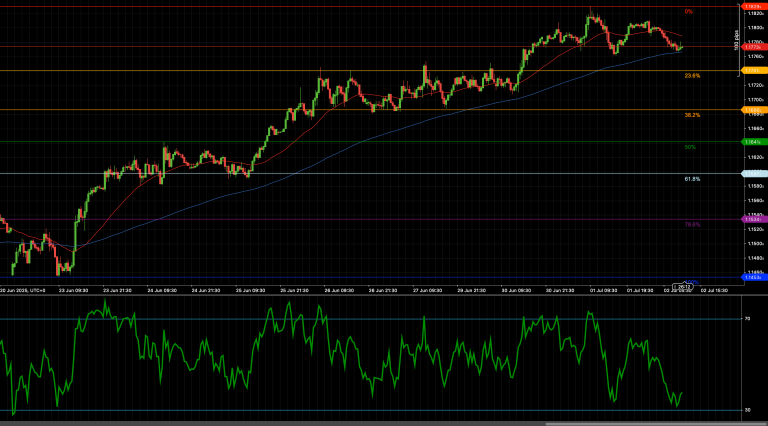
The Swiss SMI20 index rebounded from its recent low near 11,886, corresponding to the 78.6% Fibonacci retracement of the prior 650-point rally. After consolidating for several sessions, buyers regained control and lifted price toward the 61.8% retracement level at 11,926, a key short-term resistance. This rebound is accompanied by improving risk sentiment and an uptick in relative strength, suggesting bearish pressure is fading — at least temporarily.
Volume remains moderate, and broader macro conditions continue to weigh on European indices. Still, the resilience above 11,880 and improving intraday structure leave the door open for upside exploration, especially if 11,926 is cleared decisively.
📈 Technical Analysis
Key Support and Resistance Levels
The immediate resistance zone is centered at 11,926, the 61.8% Fibonacci level. A break above this could target the psychological 11,970 zone, followed by 12,005 — near the 50% retracement of the larger downtrend. Higher up, 12,095 marks the 23.6% level and the ceiling of the prior consolidation.
On the downside, 11,886 remains the first important support, followed by 11,821 (100% retracement). A break below 11,821 would resume the bearish sequence and expose 11,780 or lower as the next technical floor.
Moving Averages and Dynamic Price Action
Short-term moving averages are beginning to flatten, with the 20-period MA crossing above the 50 again. The index has reclaimed both moving averages for the first time in a week, which may help provide a base for further upside. However, the longer-term 200-MA (around 11,970) still slopes downward, serving as a potential cap unless bulls regain full momentum. The price structure remains mixed but is gradually transitioning from bearish to neutral as buyers test key zones.
RSI Momentum and Trend Strength
The RSI indicator has turned higher from sub-30 levels and is now printing near the mid-50s — signaling a potential recovery in bullish momentum. If RSI clears 60, it would add strength to a breakout above 11,926. Failure to sustain above 50 would hint at exhaustion and risk a pullback. This RSI reversal from oversold is notable and often precedes short-term bullish rallies.
Candlestick Structure and Market Tone
Recent candlesticks reflect a shift from indecision to bullish bias, with longer lower wicks and stronger bullish closes. The current candle is pressing against the 11,926 resistance, and a daily close above this level would validate buyer commitment. Still, sellers remain active just above this threshold, and failure to break out could result in another leg lower.
Chart Structure and Trend Integrity
While the broader trend remains under pressure, the recent rebound shows early signs of base-building. The shift in momentum, reclaim of moving averages, and bounce from deep retracement levels support a constructive near-term tone. If the index can establish a higher low above 11,886 and push past 11,926, it may form the foundation of a medium-term reversal.
Fibonacci Roadmap and Target Zones
Using the 650-point swing from 12,475 to 11,821, price has respected both the 78.6% retracement (11,886) and the 61.8% retracement (11,926). A sustained break above 11,926 would open the door toward 11,970, 12,005, and 12,095(23.6% Fib). Failure here would re-target 11,886, then 11,821, which would invalidate the bullish thesis and resume the downtrend.
🔍 Market Outlook & Trading Scenarios
Bullish Scenario
A confirmed close above 11,926, especially with RSI above 60, would validate bullish continuation. Upside targets include 11,970 and 12,005, with stops below 11,886 for risk control.
Neutral Scenario
Failure to break 11,926 may lead to consolidation between 11,886–11,926, with mean-reversion traders fading both edges. RSI would likely fluctuate between 45 and 60.
Bearish Scenario
A drop below 11,886, particularly on rising volume and weakening RSI, would re-expose 11,821 and lower retracement zones. Invalidation for bears would be a daily close above 12,005.
💼 Trading Considerations
- Bullish Setup: Buy breakout above 11,926, target 11,970 and 12,005, stop below 11,886
- Bearish Setup: Sell below 11,886, target 11,821 and 11,780, stop above 11,926
- Range Play: Fade the 11,886–11,926 band with confirmation signals and tight stops
🏁 Conclusion
SMI20 is attempting to carve out a bottom as it rebounds from 11,886 to challenge the 11,926 resistance. With RSI rising and the price recovering moving averages, bulls have regained momentum — but the breakout above 11,926 is critical to unlock the next leg toward 12,005. Until then, risks of chop and retracement remain.
⚠️ Disclaimer
This analysis is for informational purposes only and does not constitute financial advice. Always consult a licensed financial advisor before making investment decisions.