Copy traders who follow commodity strategy providers skip one step: a technical check on the chart before the trade copies.
Commodity charts behave differently from stocks and forex. Seasonal cycles, futures roll effects, and supply shocks shape price action in ways a standard signal won't tell you.
This guide covers what those differences mean for reading commodity charts and which technical signals matter before you copy any entry.
You can run a four-step checklist on any commodity chart: trend, support and resistance, momentum, and volatility.
What is commodities technical analysis?
Commodities technical analysis is using price charts, patterns, and indicators to forecast future price movements in raw materials markets like gold, oil, and silver.
Commodities technical analysis is a chart-based method for studying commodity prices. It helps you spot trends, momentum, and key price levels using past price and volume.
The core data inputs are:
-
Price history (open, high, low, close across any timeframe)
-
Volume (how much traded at each price level)
-
Support and resistance levels (price zones where buying or selling has clustered)
-
Momentum indicators like RSI, MACD, and CCI (scores showing if price has moved too far, too fast)
-
Volatility tools like ATR and Bollinger Bands (measure how much price is swinging)
-
Trend tools like moving averages (show the overall price direction)
Fundamental analysis asks why prices move. Technical analysis asks what price is doing right now.
Fundamental traders track supply and demand forces:
-
OPEC production decisions
-
Crop reports and harvest data
-
Geopolitical events
-
Inventory and stockpile releases
These 4 drivers explain price moves, but rarely in real time.
Futures markets are driven heavily by sentiment and speculation. Price often moves before fundamental news reaches everyone. Chart patterns on gold, oil, or wheat can signal a breakout days before a crop report or OPEC announcement is fully absorbed. TA doesn't replace fundamental knowledge. It tells you when the market is already acting on it.
This matters directly for copy traders.
Copy trading removes the need to execute trades manually, but it doesn't remove the need to understand what you're copying. Running a basic TA checklist against a strategy provider's signals gives you 3 quick verification points:
-
Is the gold position entering a confirmed uptrend, or chasing a spike?
-
Is oil approaching a key resistance level that could reverse the trade?
-
Does silver momentum support the direction being taken?
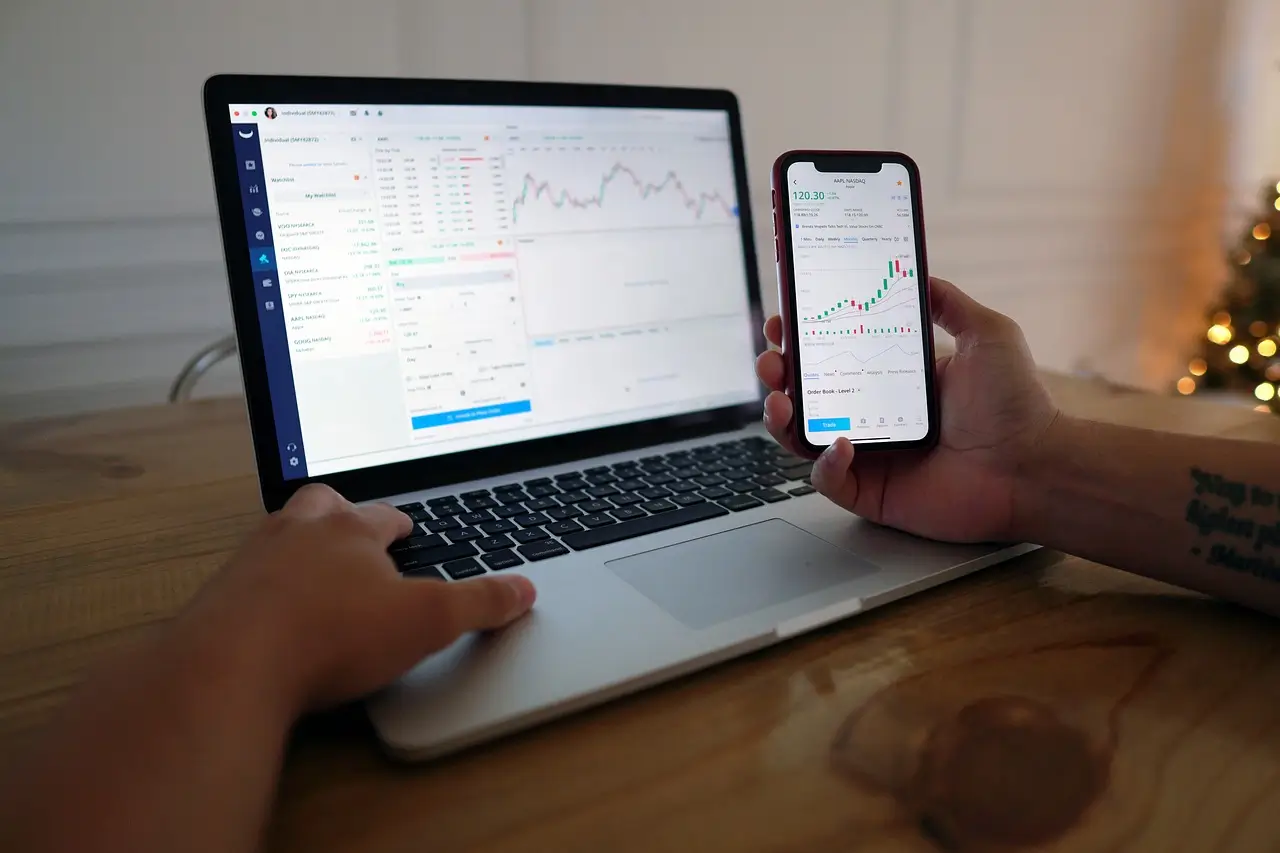
MT5 is where this happens. The charting environment strategy providers use to build their signals is available to you as a copy trader, with sub-28ms execution latency so price levels you see reflect live market conditions. Pull up the chart, overlay a moving average, check RSI, and map the nearest support before any position is copied to your account.
This doesn't mean second-guessing every signal. It means having enough context to choose strategy providers that align with market conditions you can read.
How commodities differ from stocks and forex
Commodities differ from stocks and forex through physical supply-demand drivers, seasonal price cycles, futures-based trading, and higher volatility from weather and geopolitical shocks.
-
Supply and demand imbalances: A mine flood or drought moves prices within hours, not quarters.
-
Geopolitical events: Sanctions, conflicts, and trade route disruptions reshape supply overnight.
-
Weather: A cold snap in Europe lifts natural gas demand. A dry U.S. Midwest harvest pushes wheat higher.
-
Supercycles: Multi-year price trends driven by industrialization or energy transitions have no direct equivalent in stocks or forex.
This context changes how you read signals. A bullish RSI on crude oil can be invalidated instantly by an OPEC production cut. That same decision has zero effect on EUR/USD. Fundamental context in commodities filters whether your technical signal is valid, not just background noise.
Beyond these event-driven drivers, commodity prices also follow predictable time-of-year patterns.
Commodity prices follow two dominant seasonal rhythms. Agricultural commodities track planting and harvest cycles: corn prices typically soften after harvest as supply floods the market, then firm heading into spring planting uncertainty. Energy commodities follow heating and cooling demand: natural gas prices climb during winter heating season, then retreat in spring.
Because these cycles repeat year after year, seasonal breakout patterns carry more analytical weight in commodities than in stocks or forex. A breakout in crude oil during winter heating season has historical demand seasonality behind it. A breakout in a forex pair or stock at the same time of year has no comparable seasonal force. That makes cycle analysis a more reliable confirmation tool in commodity markets.
Commodity futures differ structurally from stocks and forex spot. Each futures contract carries an expiry date. Traders must close or roll positions before expiry, which adds rollover costs. CFDs roll automatically, but the cost is still built in. Margin requirements are set by exchange-level volatility standards, not a fixed broker menu.
The leverage math makes this concrete. On VantoTrade, commodities like gold, oil, and silver offer up to 1:100 leverage. At that ratio, a $100 margin deposit controls a $10,000 notional position. A sharp move against you erases that margin fast, and commodity volatility amplifies the speed of that drawdown compared to most stock positions.
Chart types used in commodity market analysis
Commodity traders primarily use candlestick, bar, and line charts to read price action, patterns, and trends.
Four chart types appear consistently in commodity analysis, each suited to a specific read: intraday sentiment, multi-timeframe structure, long-term trend, or price-action filtering. Choosing the right one depends on your timeframe, trading style, and what you need to see.
Candlestick charts show open, high, low, and close as a single candle body with upper and lower wicks. That structure lets you read intraday sentiment at a glance. Patterns like dojis, hammers, and engulfing candles are readable on candlestick charts, making them the standard choice for spotting short-term reversals in gold and oil.
Bar charts carry the same OHLC data as candlesticks. The difference is visual: there are no color-filled bodies, which produces a cleaner layout on multi-timeframe screens. Removing color cues also reduces the pull of recent price action when reviewing historical setups, which is why systematic traders and professional futures traders default to them.
Line charts plot only closing prices. That removes intraday noise entirely. They work best on weekly or monthly commodity charts for reading long-term trend direction, and for drawing support and resistance levels without wicks distorting key zones.
MT5 supports three chart types natively, with no need to switch platforms:
-
Candlestick
-
Bar
-
Line
When auditing a copy strategy, candlestick is the practical default. It shows the open, close, and rejection wicks at each entry point, so you can see exactly what the strategy provider saw before the trade was placed.
The commodity analysis checklist: four steps to read any market
The commodity analysis checklist is a four-step process - trend identification, support/resistance mapping, momentum gauging, and volatility measurement - that gives you a repeatable way to read any commodity chart before placing or copying a trade.
No single indicator answers every question. Each class covers a different dimension of the market. Here's what each one tells you:
-
Moving averages: trend direction
-
Support and resistance: where price historically stalls or reverses
-
RSI: whether momentum is exhausting or still building
-
Bollinger Bands and ATR: whether the market is calm or about to break
Using all four prevents confirmation bias from a single signal. For copy traders, running this checklist on a strategy provider's recent entries shows whether their trades align with trend and momentum, or whether they're fading a strong move without a volatility-backed reason.
All four indicators are built into MT5, VantoTrade's native charting platform. Here's what you need:
-
MT5 for charting and order execution
-
Moving averages for trend direction
-
RSI for momentum readings
-
Bollinger Bands and ATR for volatility context
No additional installs are required. You still need to add the indicators to a chart and save a template once.
Once indicators are pre-configured in a chart template, a full four-step checklist pass takes 3–5 minutes per commodity chart for an experienced trader.
Step 1: Identify the trend with moving averages
Plot a 50-period and 200-period moving average on your chart: price above both signals an uptrend, price below both signals a downtrend, and a crossover signals a potential trend change.
SMA suits gold and slow-moving commodities. It weights all periods equally, which smooths out noise without overreacting to recent price swings.
EMA suits crude oil and natural gas. It weighs recent prices more heavily. That extra responsiveness fits markets where momentum shifts fast.
Both the 50 and 200 MAs filter out short-term spikes and show you the underlying directional bias.
Crossovers using the 50 and 200 MAs are trend signals, but they need confirmation in choppy markets.
-
Golden cross: bullish trend signal when the 50 MA crosses above the 200 MA, suggesting upward momentum is building.
-
Death cross: bearish trend signal when the 50 MA crosses below the 200 MA, pointing to downward pressure.
Caveat: both signals produce false positives during sideways price action. Confirm with a momentum indicator before acting (covered in Step 3).
Use the 50 and 200 MAs as a quick sanity check before following any copy trade entry.
Buy signals carry more weight when price is above both MAs. Sell signals carry more weight when price is below both.
Counter-trend entries aren't automatically wrong. Check their historical drawdown before copying any provider who buys gold while price sits below both the 50 and 200 MA.
Step 2: Map support and resistance levels
Scan the chart for historical price peaks and troughs, mark horizontal zones where price reversed at least twice, then note any active trendlines - these become your support and resistance map.
Support is a price level where a falling commodity attracts buyers. Resistance is where sellers step in to cap a rally. In practice, treat both as zones, not exact lines.
Draw a small price band around each turning point to account for wicks and volatility. Gold testing $2,000/oz three sessions in a row before bouncing is a zone, not a single price. Diagonal support along an uptrend is as valid as any horizontal level.
Here's what makes a level worth trusting:
-
Number of tests: The more times a level holds without breaking, the stronger it becomes. A level tested repeatedly carries more weight than one touched once.
-
Role reversal: When support breaks decisively, it becomes resistance. When resistance breaks, it becomes support. This flip signals the start of a new trend.
-
Round numbers: Psychological levels like $2,000/oz for gold or $80/barrel for WTI crude act as natural S&R zones because large orders cluster at these prices.
Before copying a strategy provider's trade, mark the nearest S&R zones on the chart yourself. A credible long entry should sit close to a defined support zone. A credible short should sit near resistance. An entry placed in the middle of a range with no nearby S&R anchor is a red flag. It means the trade has no structural logic behind its timing.
Step 3: Gauge momentum with RSI and oscillators
Check RSI for overbought (above 70) or oversold (below 30) conditions, confirm with MACD crossovers or CCI, and look for divergence between price and the oscillator to spot weakening momentum before it reverses.
RSI runs on a 0–100 scale. Readings above 70 signal overbought conditions; below 30 signal oversold. Treat these as caution zones, not automatic triggers.
In strong commodity trends, gold during a safe-haven rally can stay above 70 for extended periods. Acting on the overbought reading alone means selling into strength. Wait for RSI to drop back below 70 before entering a reversal.
MACD confirms what RSI suggests. When the MACD line crosses above the signal line while RSI rises from below 50, both indicators agree: momentum is bullish. When they diverge (RSI falling while MACD still climbs, or vice versa), the signal weakens.
A third oscillator can add conviction when MACD and RSI agree.
ROC is an optional add-on: if the Rate of Change accelerates in the same direction as the MACD cross, the move has conviction behind it, not just noise. It does not replace the MACD + RSI check.
RSI divergence is a key warning sign on commodity charts:
-
Bearish divergence: Price makes a higher high, RSI makes a lower high. Momentum is fading while price still rises. Watch for this around potential oil tops when supply data shifts sentiment.
-
Bullish divergence: Price makes a lower low, RSI makes a higher low. Selling pressure is exhausting itself. Look for this during corrective pullbacks in gold or silver uptrends.
-
CCI confirmation: If the Commodity Channel Index also diverges from price while RSI diverges, the reversal signal is significantly stronger.
Oscillators reveal whether a strategy provider is entering at a reasonable point or chasing momentum. Before copying a commodity trade, check the RSI reading at the provider's entry timestamp.
| RSI Zone | What It Signals |
|---|---|
| Below 50 | Early-trend entry, best risk/reward |
| 50–70 | Acceptable if trend is strong and MACD confirms |
| Above 70, no divergence | Provider is chasing momentum, risk/reward has deteriorated |
A repeated pattern of entries above 70 with no divergence is a red flag worth noting before you commit capital.
Step 4: Measure volatility with Bollinger Bands and ATR
Read Bollinger Band width to gauge volatility expansion/contraction, and use ATR to size stops and filter low-volatility fakeouts before acting on a commodity signal.
Bollinger Band width shows whether volatility is expanding or compressing. The bands plot a 20-period moving average with upper and lower lines set ±2 standard deviations away. Widening bands mean volatility is expanding. When the bands pinch inward (a squeeze), a breakout is building.
In range-bound markets like gold, price closing outside the upper or lower band signals the market has stretched too far from its mean. That's a potential reversal zone, not a continuation entry.
ATR (Average True Range) measures the average candle range over the last 14 periods. A rising ATR means volatility is expanding. A falling ATR means the market is coiling.
Entries in low-ATR environments get stopped out by noise before the move develops. Here's how it plays out on gold: ATR drops to half its 30-day average during a quiet Asian session, a long entry triggers, and the next two candles chop in both directions before price moves at all. The stop at a tight level gets hit before the real move starts. Placing stops at 1.5–2× ATR below entry gives the trade enough room to develop without overexposing capital.
BB gives the visual read; ATR gives the numeric confirmation.
Applied to a gold chart: the bands pinch for three sessions, ATR reads well below its 30-day average, and a strategy provider posts a long entry. That combination means the market lacks the range to push price far enough to cover spread and commission costs. Low-volatility noise consumes the move before it pays out.
Use the signals together:
-
BB expanding + ATR rising: Volatility supports the move. A breakout trade has range behind it.
-
BB squeezing + ATR falling: Market is coiling with no energy. Wait for the expansion.
-
BB squeezing + ATR falling on a copy trade entry (gold or oil): Red flag. In this environment, spreads and commissions consume too much of the expected move. Pause before copying that signal.
Optional confirmation: Volume and open interest (futures markets)
Volume and open interest are optional futures-market confirmation tools: volume measures transaction frequency, and open interest counts outstanding contracts to validate trend conviction.
Volume rises every time a buyer and seller transact a futures contract. High volume on a price move signals stronger participation and conviction behind that move. Low volume on the same move raises doubts.
On Balance Volume (OBV) confirms this: when OBV rises alongside price, the bullish trend has real conviction. Falling volume on a rally is a warning sign that the move lacks follow-through.
NB! Volume and open interest data are futures-specific. These signals are not available on CFD platforms, where contracts have no centralized exchange reporting.
Open interest (OI) is the total number of outstanding futures contracts not yet settled. Rising OI means new money is entering the market and confirms the trend. Falling OI means positions are closing and momentum is fading.
The four classic combinations:
| Price | Open Interest | What It Signals |
|---|---|---|
| Rising | Rising | Strong uptrend, new money entering |
| Rising | Falling | Short covering, weak rally |
| Falling | Rising | Strong downtrend, new money shorting |
| Falling | Falling | Long liquidation, potential bottom |
The Herrick Payoff Index (HPI) is one of the few indicators built specifically for futures. It combines price, volume, and open interest to flag bullish and bearish divergences before they show up in price alone.
For copy traders, the OI direction check is a structural sanity check before following any strategy provider's futures entry. A rally is likely short-covering, not a genuine new trend worth copying, when OI is falling as price rises.
Key chart patterns for commodity trading
Key commodity chart patterns are Head & Shoulders, Double Tops/Bottoms, Triangles, and Wedges, each signaling either a reversal or continuation.
Reversal patterns warn you the trend is losing steam before it turns.
-
Head & Shoulders: a central peak (the head) flanked by two lower peaks (the shoulders). A neckline break confirms the reversal.
-
Double top: price tests a resistance level twice, fails both times, and turns bearish.
-
Double bottom: the mirror image at support, marking the start of a bullish move.
Continuation patterns show consolidation mid-trend before the prior move resumes.
-
Triangles (ascending, descending, symmetrical): price compresses into a tighter range, then breaks in the original trend direction.
-
Wedges are counter-intuitive: a rising wedge signals a bearish reversal; a falling wedge signals a bullish one.
-
Flags: a brief, tight pullback after a strong move that resolves back in the original direction.
Candlestick patterns add a short-term confirmation layer on top of the larger structure. Every candlestick pattern falls into two axes: continuation or reversal, and bullish or bearish.
At key support or resistance, watch for doji (indecision) and engulfing candles (stronger conviction). A bullish engulfing at support adds weight to a double bottom. A bearish engulfing at resistance reinforces a double top. Candlesticks don't replace the larger pattern. They confirm it.
Patterns as a copy-trade sanity check. When a strategy provider opens a long trade and the chart shows a completed Head & Shoulders with a broken neckline, the structure argues directly against that direction. That's a structural mismatch.
Before copying, check whether their timeframe differs from yours. A double top sitting above a long entry is quick to spot and can prevent you from following a trade that runs against the chart structure.
Risk management for commodity trades
Commodities carry more volatility per price move than most stocks or forex pairs. Leverage multiplies that exposure fast. These four rules keep losses manageable.
-
Stop-loss placement. Set stops at 1.5–2× ATR below entry to absorb normal daily swings without getting shaken out. Parabolic SAR works well as a trailing stop in trending markets, automatically ratcheting closer to price as a trade moves in your favor.
-
Per-trade risk sizing. Risk no more than 1–2% of account equity per trade. On a $5,000 account, your stop must cap the loss at $50–$100, regardless of how large your position is. Size the position to the stop, not the other way around.
-
Leverage risk in commodity markets. Gap moves happen fast in commodities. OPEC decisions, geopolitical shocks, and CPI prints can push prices through stop levels before orders fill, leaving losses beyond posted margin. VantoTrade's Raw Account offers up to 1:500 leverage with a 30% stop-out level. Know that threshold before sizing any position. It tells you the maximum adverse move your account survives before forced liquidation.
-
Non-price risks. Price charts don't capture everything. Three risks sit outside the chart entirely:
-
Fraud risk: Trafigura recorded ~$577 million in impairment after nickel containers turned out to hold lower-value materials. No technical setup flags that.
-
Sanctions risk: Nayara Energy lost access to SBI foreign currency transactions due to US/EU sanctions concerns, cutting off its crude oil trading.
-
Currency risk: The South African rand strengthened in early 2025 as record gold prices lifted export receipts. Importers paid more even as gold producers gained.
Applying the checklist as copy-trading guardrails
Applying the checklist as copy-trading guardrails means using your four-step trend, S&R, momentum, and volatility analysis to validate a strategy provider's signals before following them. Then set predefined rules on when to pause copying, how much risk to allow per trade, and what drawdown level triggers a stop.
Copy trading keeps your leverage exposure intact. A provider's past drawdown statistics reflect conditions that have already passed.
They don't predict how a strategy behaves when OPEC cuts output overnight or a CPI print sends gold spiking. Use a simple technical checklist as a sanity filter before copying any signal.
On a dealing-desk broker, fills on copied commodity positions can lag or widen during volatility spikes. That's the moment the signal matters most, and it's also when you take the worst entry.
VantoTrade doesn't profit from your losses. Orders go straight to tier-1 liquidity providers in under 28ms, so any slippage on a copied oil or gold entry reflects actual market conditions, not the broker working against you.
The guardrails workflow runs in three sequential layers:
-
Validate before copying - run the provider's recent signals through a technical checklist before you link your account.
-
Cap size during copying - limit each copied trade to 1-2% of your account and total commodity exposure to 5-10% of your portfolio.
-
Exit systematically - define drawdown thresholds before you start, and stop copying when they breach.
VantoTrade's copy trading runs through the Client Portal, giving you real-time performance visibility across all three layers from one place.
When to pause or stop copying a strategy
Pause copying when a strategy's drawdown exceeds your pre-set limit, its win rate drops sharply over 20+ trades, or market conditions shift away from its edge - stop permanently if the provider breaks risk rules or the equity curve shows structural deterioration.
Pause at 2× peak drawdown. Stop permanently on stop-loss removal, 3× sizing, or overtrading. The line between the two is provider behaviour: drawdown alone is a diagnostic question. Behaviour that breaks process is the final answer.
Pause triggers to watch:
-
Drawdown threshold: Pause when open drawdown reaches 2× the provider's historical peak. Pause at 16% if their worst dip was 8%. That gap separates normal variance from something structural worth investigating.
-
Win rate decline: A win rate falling more than 15 percentage points below the provider's 90-day average across the last 20 closed trades signals edge degradation, not bad luck.
-
R:R deterioration: Shrinking R:R is an early warning signal. When stops widen and targets tighten, pause and reassess before the next drawdown leg develops.
-
Checklist regime check: Run the four-step checklist against recent signals. If Step 1 (trend) has flipped from the provider's preferred direction and Step 3 (momentum) confirms divergence, the conditions that built their track record are gone. Watch Step 4 ATR specifically around OPEC headlines and CPI releases. ATR expansion on those events signals a regime shift, not just volatility.
Permanent stops are reserved for provider behaviour that shows broken process, not just poor results. Three hard red flags:
-
Provider moves or removes stop-losses on losing positions
-
Provider sizes up to 3× their normal lot size without explanation
-
Provider overtrades: a burst of low-quality setups in a short window
VantoTrade's Client Portal lets you monitor open drawdown in real time, so you can act on any of these triggers before hitting your hard limit.
Cap risk per trade and total exposure when copying
Set a per-trade risk cap of 1–2% of your account and a total copied-portfolio exposure cap of 5–10%, adjusting lot sizing or using fixed fractional allocation in your copy settings.
In copy trading, the provider's lot sizes are calibrated to their account, not yours. Copying at 1:1 when your account is smaller means you take proportionally more risk per signal than the provider intended.
Fixed fractional sizing keeps this in check. Here's how the math works:
-
Set a 1–2% per-trade risk cap on your account equity
-
On a $5,000 account at 1%, your max loss per copied signal = $50
-
That $50 figure determines the lot size in your copy ratio, not the provider's original lot
-
Copy proportionally to your account size, not at the provider's absolute position size
Leverage makes total exposure easy to underestimate. At 1:500, a $200 margin deposit controls $100,000 in notional value, so your account balance can look stable while your actual market exposure is far larger than the margin figure suggests. This is why sizing rules must be set before copying begins, not adjusted after a drawdown has already started.
Across multiple copied strategies running simultaneously, keep total copy exposure to 5–10% of account equity. This limits the damage if correlated strategies draw down together. Correlation between strategies tends to increase during broad market shocks, shrinking the diversification benefit exactly when you need it most.
VantoTrade's copy trading settings let you lock these limits in at the platform level. Per-strategy risk allocation is built into the copy configuration, so your exposure cap applies automatically to each signal without manual tracking.
The platform enforces a 50% stop-out floor on both Standard and Raw accounts as an absolute last-resort backstop. Your personal per-trade and portfolio caps should trigger well before that floor is reached. The stop-out is not a risk management tool. It is a margin protection mechanism for extreme scenarios.
Define drawdown limits and red flags before you copy
Set your rules before you copy, not after. Once you're watching a losing position in real time, emotions take over and rational decisions become harder. Decide your exit conditions upfront, in writing, before a single trade copies.
A standard institutional rule is a 20% maximum drawdown on any single strategy allocation before pausing. At that level, you need a 25% gain just to recover to breakeven. The math compounds against you fast.
VantoTrade's platform stop-out triggers at 50% margin. Set your personal ceiling well before that threshold so you exit by choice instead of by force-closure. Wait for the system to act and the decision has already been made for you.
Watch for these 3 behavioral red flags before your drawdown limit is hit:
-
Overtrading spike: A provider averaging 3 trades per week suddenly opens 15 in a single day. That signals emotional, undisciplined trading, not a strategy adjustment, and it is a leading indicator of drawdown.
-
Stop-loss removal: A provider stops showing visible stop levels. Losing positions stay open with unlimited downside. This is the fastest way to blow a copy allocation.
-
Strategy drift: A gold trend-following provider suddenly trades unrelated markets or uses lot sizes outside their historical norm. The original edge has likely broken down. Pause immediately.
The Client Portal is the most reliable place to enforce these rules in real time. Here is the 3-step process: (1) Open the provider page and check the live equity curve for any sudden downward slope. (2) Scan open positions for missing stop levels and unfamiliar markets or abnormal lot sizes. (3) Pause your allocation when drawdown hits 20%, well before VantoTrade's 50% stop-out forces the closure.
Because VantoTrade uses A-Book execution, the performance data you see reflects real market conditions, not a demo environment. Keep leverage in mind: at 1:500, a 1% adverse move can wipe 500% of margin if the provider sizes incorrectly. Your drawdown ceiling and red flag checklist are what stop leverage from turning one bad provider into a catastrophic loss.
Platforms and tools for commodity analysis
MT5 handles technical analysis, charting, and automation. Copy trading runs through the Client Portal on desktop, web, and mobile.
MT5 covers every step of the commodity checklist with built-in indicators, no plugins needed:
-
Trend: Moving averages (SMA, EMA, WMA) across any timeframe
-
Support/resistance: Horizontal line and Fibonacci drawing tools
-
Momentum: RSI, MACD, and Stochastic oscillators
-
Volatility: Bollinger Bands and ATR, both native
-
Volume confirmation: Tick volume and on-balance volume for futures markets
Available instruments include XAU/USD, XAG/USD, and UK Brent crude as CFDs. Execution runs through an A-Book model at sub-28ms speeds.
VantoTrade's copy trading is the right starting point if you want commodity exposure without running the analysis yourself. Browse strategy providers by asset class, filter by drawdown history and return profile, and monitor real-time equity curves before committing funds. Account minimums start at $25 (Standard) or $100 (Raw, with spreads from 0.0 pips plus commission).
VPS via ForexVPS.net keeps MT5 automated strategies running 24/7 with 99.9% uptime. No local machine required.
Put Your Commodity Analysis to Work on VantoTrade
A technical checklist only delivers edge when your broker executes it cleanly. Spreads that widen during a commodity spike or fills that arrive after the level breaks erase a setup before it starts. A fill arriving 400ms late on a gold breakout can mean entering 30 pips above the intended level. Sub-28ms execution keeps fills at the level they need to be.
You can trade Gold (XAU/USD), Silver (XAG/USD), and Oil (UK Brent) as CFDs alongside Forex, Indices, and Crypto from one account. Raw spreads start from 0.0 pips with up to 1:100 leverage on commodities. MT5 is available on desktop, web, and mobile.
For commodity traders working off tight technical levels, the Raw Account is the better fit: 0.0 pip spreads and a flat $3.50/lot commission keep costs predictable at every entry. Orders route via A-Book/STP to tier-1 liquidity providers in under 28ms, with no dealing desk between your signal and the market. The Standard Account (1.0 pip spreads, no commission) works for lower-frequency setups.
If you're not yet trading commodity strategies yourself, copy trading on VantoTrade runs with real-time sync and sub-28ms latency, so your copied positions enter at the same price as the strategy provider's. Apply the four-step checklist to a provider's recent gold or oil entries before you copy, then set risk caps of 1-2% per trade.
EA traders can connect through ForexVPS.net for 99.99% uptime, keeping automated strategies running continuously.
Start with a Standard account at $25, or open a Raw account at $100 if you're trading off technical levels and need the tighter spreads. Open an account at VantoTrade.
FAQ
What is the difference between technical analysis and fundamental analysis?
Fundamental analysis evaluates a commodity's intrinsic value through economic factors, while technical analysis uses historical price and volume data to predict future trends.
Fundamental analysis (FA) uses supply/demand data, OPEC decisions, weather patterns, and inventory reports. Technical analysis (TA) uses price charts, volume, and indicators like RSI, MACD, and moving averages.
FA identifies what to trade by assessing long-term value. TA determines when to enter or exit based on short-term price behavior and market psychology.
Most professional commodity traders combine both approaches. FA builds the long-term directional view (e.g., rising oil inventories = bearish bias), while TA times the entry on pullbacks or breakouts.
Does fundamental analysis work with commodities?
Fundamental analysis works for commodities by using supply-demand dynamics, inventory levels, and macroeconomic indicators to predict long-term price trends and risk premiums.
Low inventory levels predict higher futures returns, generating an 8.06% annualized excess return in portfolio tests. Industrial production growth is a primary driver for metals and energy, predicting up to +70 bps in monthly excess returns.
FA models carry high noise with R² values of just 0.03-7%, making precise short-term timing unreliable. Predictability peaks at 1-4 month horizons and rarely beats simple benchmarks at intraday or 6-month-plus timeframes.
CFD traders use Gold, Silver, and Oil CFDs to speculate on fundamental shifts without physical delivery. A practical approach: use FA to form a directional bias, then wait for TA confirmation (e.g., a support bounce or RSI reset) before entering.
How often is technical analysis correct?
Technical analysis is a probabilistic tool with historical success rates between 30% and 60%, though modern market efficiency often reduces net profitability to near zero.
A review of 92 modern studies found 63% showed positive TA results, though gains dropped significantly in futures markets after the 1990s. Early commodity systems on corn and sugar (1975-1984) returned 1.89-2.78% monthly using trend-following rules.
Transaction costs of 0.05-0.15% can halve TA outperformance, turning accurate signals into losing trades. In gold and silver, no technical rules remained statistically significant after adjusting for data-snooping bias and real-world trading lags.
Treat TA as a filter for trends and key levels, not a standalone prediction engine. Apply the four-step checklist (trend, support/resistance, momentum, volatility) as a sanity check before copying a strategy or placing a trade.
What are the most important crude oil contracts?
The most important crude oil contracts are West Texas Intermediate (WTI) and Brent, which serve as the primary global pricing benchmarks.
WTI (Light Sweet Crude) averages over 1 million contracts daily, making it the world's most liquid oil market. VantoTrade Raw Account holders trade Oil with spreads from 0.0 pips and a flat $3.50/lot commission, keeping costs predictable for technical traders running high-frequency setups.
Brent prices roughly two-thirds of the world's internationally traded physical oil, making it the dominant global benchmark. ICE Brent hit a record open interest of 3.2 million lots in late 2025, reflecting deep institutional participation.
Shanghai Crude (SC) is now the third-largest oil contract globally and the primary benchmark for Asian buyers. Dubai Crude and DME Oman handle Middle Eastern sour crude pricing for exports into Asia.
VantoTrade supports Oil CFD trading including UK Brent, giving traders direct access to the world's most-watched crude benchmark. Open a Raw Account to trade Brent with raw spreads and zero commission.