
Educational content. This article explains fundamental analysis frameworks commonly used in commodity markets; it does not constitute investment advice or recommendation. Analytical examples are illustrative; past patterns do not guarantee future results. CFD trading carries significant risk of loss and may not be suitable for all investors.
EIA inventory reports, COT positioning data, CPI releases, and Fed decisions hit the market every week. Beginner traders see the numbers but have no structured process to interpret them as part of an analytical workflow.
This guide describes a repeatable weekly workflow for commodity CFD analysis using EIA supply data, COT reports, and CPI/Fed signals. The output is a structured analytical view on gold, silver, and oil; how that view translates into trade decisions depends on individual circumstances, risk tolerance, and other factors.
That analytical view is applied to three markets: gold, silver, and oil. Each walkthrough illustrates how the same data set can be interpreted, rather than prescribing a specific trade.
What is fundamental analysis?
Fundamental analysis is evaluating a commodity's true value by studying supply and demand variables, macroeconomic data, and market conditions.
In practice, FA means tracking the forces that push supply and demand out of balance. When OPEC announces a production cut, less oil enters the market and prices move higher over the following days and weeks. Not minutes.
Macro data drives commodity prices just as directly as supply news. A higher-than-expected CPI print signals rising inflation, which pushes gold and silver higher as traders seek inflation protection.
Fed rate decisions affect the cost of holding non-yielding assets like gold. A rising DXY (the US dollar index) pushes commodity prices lower, because commodities priced in USD become more expensive for buyers holding other currencies. The same Fed-cycle read also drives equity indices - if you trade stock index CFDs alongside commodities, our indices trading strategies guide maps the same macro inputs to entry and exit rules.
The output of all this analysis is a directional bias: a reasoned analytical view on whether the macro inputs are currently associated with upward or downward pressure on a commodity over the next few sessions. Analytical views may or may not be borne out by actual price movement; past correlations do not guarantee future results.
Fundamental analysis vs. technical analysis
Fundamental analysis evaluates supply, demand, and macro factors to assess an asset's intrinsic value, while technical analysis uses price charts and volume history to describe historical movement patterns. Past patterns do not guarantee future results.
Fundamentals describe why a market may be moving and in which direction the inputs lean. Technicals describe where and when historical patterns have appeared. Used together, they cover more ground than either approach alone.
For beginners trading commodity CFDs, this distinction is practical. FA frameworks reference a weekly analytical view before the chart is even opened. Technical frameworks then reference entry timing and stop placement.
Many traders use fundamentals to build an analytical weekly view and technicals to reference entry timing and stop placement. Whether and how this is applied to trade decisions depends on individual circumstances.
How commodity markets work
Physical supply and demand set the baseline price. When a drought cuts wheat harvests or OPEC trims oil output, prices move because the underlying commodity becomes scarcer.
Futures markets layer on top of that. They price in what traders expect to happen next, not just what is available today. As a CFD trader, you never take delivery of a barrel of oil or a gold bar. You trade the price movement directly, which makes commodities accessible with a small starting deposit like $25.
Types of commodities and asset classes
The four main commodity categories each behave differently, driven by their own supply and demand dynamics:
-
Energy: Prices move on inventory reports, OPEC decisions, and geopolitical risk. Key instruments: Brent crude oil, natural gas (why natural gas prices rise in winter covers storage, weather and seasonality). Vanto offers Brent Oil CFDs.
-
Metals: Split between precious metals (inflation hedge, store of value) and industrial metals (economic demand signals). Key instruments: Gold (XAUUSD), Silver (XAGUSD), aluminum. Vanto offers Gold and Silver CFDs.
-
Agriculture: Driven by weather, crop reports, and seasonal cycles. Key instruments: wheat, cattle.
-
Soft commodities: Tropical crops sensitive to climate and export policy. Key instruments: sugar, cotton, cocoa, coffee.
Key factors that drive commodity prices
Commodity prices are driven by supply-side factors (production, weather, geopolitics), demand-side factors (macro data, inflation, currency), and trader positioning.
Supply-side drivers: production, weather, and geopolitics
Supply-side drivers control how much of a commodity is physically available. Three forces matter most for commodity CFD traders:
Production decisions (OPEC output quotas for oil)
Weather disruptions (hurricanes, droughts)
Geopolitical events (sanctions, conflicts near shipping routes, mine closures)
OPEC output decisions directly set oil supply. When member nations agree to cut production by 1 million barrels per day, fewer barrels reach the market and prices rise.
Weather can shut down production fast. Hurricanes in the Gulf of Mexico force offshore oil platforms to halt operations, while droughts in major growing regions cut agricultural commodity harvests and tighten supply.
Geopolitical events remove supply from global markets. Sanctions on Russia or Iran oil exports reduce the barrels available to buyers, and conflicts near the Strait of Hormuz raise the risk of disrupted tanker routes that carry roughly 20% of global oil supply. Why geopolitical shocks lift oil and gold differently covers how such a shock transmits to each market.
Metals face similar risks through mine closures. A government-ordered shutdown of a copper or gold mine cuts output and tightens global supply enough to move futures prices.
Demand-side drivers: macro data, inflation, and currency
Three macro forces shape demand for every major commodity:
-
USD strength (DXY): A stronger dollar makes dollar-denominated commodities more expensive for foreign buyers, reducing demand.
-
Interest rate decisions: Higher rates raise the cost of holding non-yielding assets like gold and slow economic growth, cutting industrial demand for oil.
-
CPI data: Rising inflation pushes traders toward gold as an inflation hedge, but also signals likely rate hikes that strengthen the USD.
Nearly every commodity trades in US dollars. When the dollar strengthens, buyers in euros, yen, or ringgit pay more for the same barrel of oil or ounce of gold, so demand falls.
A practical example: if the DXY (dollar index) jumps after a Federal Reserve meeting, gold priced in euros becomes more expensive overnight, even if the USD price of gold stays flat. That alone can push traders to sell.
Interest rate decisions hit commodities from two sides. Higher rates raise the cost of holding non-yielding assets like gold, because investors can earn more from bonds instead. Higher rates also slow economic growth, which cuts industrial demand for oil.
CPI data carries a second-order effect beyond the headline number. Rising inflation pushes traders toward gold as a hedge against purchasing-power loss.
Rising CPI also signals that central banks are likely to raise rates, which feeds back into USD strength and weighs on broad commodity demand.
GDP and PMI readings round out the demand picture. Strong GDP growth and rising PMI figures signal more industrial activity, which lifts oil and base metal demand. Weak readings do the opposite, and traders often act on the data before official rate moves even happen.
Trader positioning and COT reports
The Commitments of Traders (COT) report is a free weekly publication from the CFTC, available at CFTC.gov. It releases every Friday and reflects positions held as of the prior Tuesday, covering futures markets including gold, silver, crude oil, and natural gas.
The report splits market participants into three groups, each with a different motive:
Managed Money: Hedge funds and large speculators trading for profit
Commercials: Producers and hedgers (miners, oil companies) who hedge physical exposure and usually take the opposite side
Non-Reportable: Small retail traders with positions below reporting thresholds
Focus on the Managed Money net position, which is simply longs minus shorts. It's the most useful directional signal because hedge funds drive short-term price momentum in commodity futures.
Multi-year extremes in Managed Money net longs have historically been associated with crowded positioning and elevated reversal risk, rather than trend confirmation. Past correlations do not guarantee future results.
In analytical frameworks, an unwind of longs is commonly interpreted as a bearish input for the XAUUSD weekly view when the same group starts reducing exposure.
Your weekly commodity analysis checklist
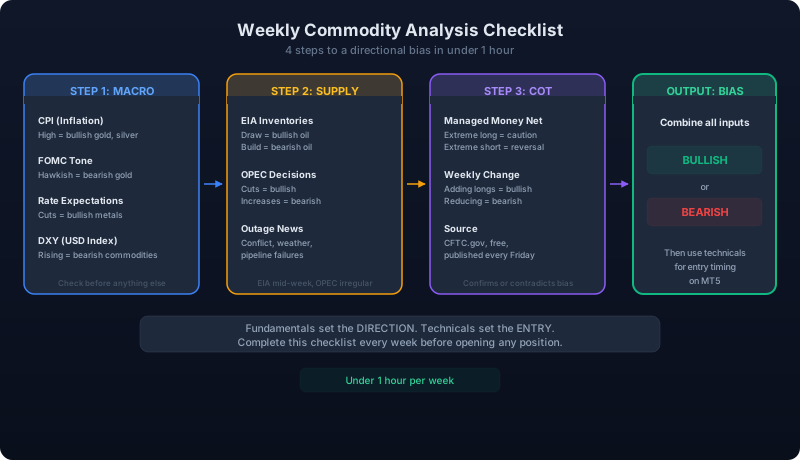
A weekly commodity analysis checklist is a four-step process: scan the macro calendar, review supply data, check COT positioning, then combine those inputs into a structured analytical view, typically completed in under an hour each week.
Step 1: Check the macro calendar (CPI, FOMC, rates, USD)
Check the economic calendar for CPI release dates, FOMC meeting dates, and current interest rate expectations, then note the USD index (DXY) trend. These four inputs set the macro bias that drives gold, silver, and oil prices for the week. Check them before looking at any supply or positioning data.
-
CPI (inflation report): A higher-than-expected print signals persistent inflation, which supports gold and silver as real-asset hedges and broadly lifts commodity prices including oil.
-
FOMC (Fed rate decision) tone: A hawkish tone strengthens the USD and pressures gold, silver, and oil prices; a dovish tone weakens the dollar and gives commodities room to rally.
-
Rate expectations: Track whether markets are pricing in more hikes, a pause, or cuts. Shifting expectations move gold and oil faster than the actual Fed decision does.
-
DXY (US dollar index) trend: A rising dollar makes dollar-denominated commodities more expensive for foreign buyers, which reduces demand and weighs on gold, silver, and oil prices.
These four inputs come first because they define the macro direction that all supply, demand, and positioning data either confirms or contradicts.
Step 2: Track supply data (EIA inventories, OPEC, outages)
Check EIA weekly inventory reports (oil), OPEC production decisions, and unplanned outage news each week. Together they tell you whether supply is tightening or loosening, which directly moves commodity prices.
Supply data tells you whether physical markets are tightening or loosening. Three sources cover most of what moves oil prices week to week. Local supply shifts also show up quickly in commodity basis, the spread between local cash and futures prices that often moves before the broader chart reacts.
-
EIA Weekly Inventory Report: Tracks crude oil and refined product stocks in U.S. storage. A draw (stockpiles falling) signals tightening supply, which is bullish (price-supportive). A build (stockpiles rising) signals oversupply, which is bearish (price-negative). Compare the headline figure to analyst estimates, because a bigger-than-expected draw carries more weight than the raw number alone.
-
OPEC Production Decisions: OPEC+ sets output quotas periodically. Cuts tighten supply and support prices. Increases loosen supply and push prices lower. Track meeting dates because quota headlines can reprice oil quickly, even before physical flows change.
-
Unplanned Outage News: Geopolitical disruptions, severe weather, or pipeline failures can remove supply without warning. Watch for:
-
Conflict or sanctions affecting major producers
-
Extreme weather shutting down rigs or refineries
-
Pipeline or infrastructure failures
EIA publishes data mid-week on a fixed schedule. OPEC decisions are irregular, so track both on an ongoing basis.
Step 3: Review positioning (COT) and sentiment
Open the CFTC's weekly COT report, find your commodity's Managed Money net position, note whether it is at a historical extreme, and log whether large speculators are adding or reducing exposure.
The Commitments of Traders (COT) report is published every Friday on CFTC.gov and it's free. It shows how large institutional players are positioned across major markets, including:
-
Gold
-
Silver
-
Oil
Focus on the Managed Money net position (longs minus shorts). The key question: is it near a historical extreme? When net longs are at a multi-year high, that's a crowded trade. Crowded trades carry reversal risk because most buyers are already in, leaving fewer to push price higher.
Watch for speculators actively reducing their net long position week over week. A sustained week-over-week reduction in net longs signals an unwind that precedes trend shifts, even before price charts confirm it.
Analytical note: Extreme crowding in Managed Money net longs has historically been associated with limited additional buying capacity and elevated reversal risk, since most participants are already positioned in the same direction. In analytical frameworks, a positioning reset (net longs falling back toward average levels) is commonly referenced before viewing further upside as a structurally supported scenario. Past correlations do not guarantee future results.
Step 4: Convert the inputs into a structured weekly analytical view
Score your macro, supply, and COT inputs as bullish, bearish, or neutral, tally the alignment, write a one-sentence analytical summary, then, if you decide to act on it, define an entry trigger, stop-loss, and position size before the week opens. Whether to act, and how, depends on individual circumstances and risk tolerance.
With your macro, supply, and COT data collected, convert it into a single structured view using this scoring process.
- Score each input as bullish, bearish, or neutral so every data point becomes a vote in the analytical framework rather than background noise. Assign one label to each of the three analysis layers:
-
Macro: CPI direction, rate expectations, USD strength
-
Supply: Inventory levels, production changes, OPEC decisions
-
Positioning: COT net stance (commercials vs. speculators)
-
Tally the alignment because the number of agreeing inputs informs how much weight the analytical view carries. Three inputs aligned = strong analytical lean. Two against one = directional skew toward the majority side. All three mixed = inputs are conflicting and do not produce a clear analytical view this week.
-
Write a one-sentence summary statement because it forces a clear analytical conclusion rather than a vague narrative. For example: "Macro and supply inputs are currently leaning to the downside on oil: inventories rising, OPEC output unchanged, USD strengthening: a combination historically associated with downward price pressure." If you can't write it in one sentence, the analytical view isn't clearly defined.
-
If you decide to translate the analytical view into a trade, set the plan before the week opens. This is a personal decision; the analytical view itself is not a recommendation. The plan typically defines three things:
-
Entry trigger: a specific price level or a scheduled data release
-
Stop-loss: a defined exit if price moves against the view
-
Position size: sized to the stop distance, not the strength of conviction
Write these down before Monday. Changing them mid-week defeats the purpose of having a plan.
An analytical view describes how inputs currently lean, not that any trade will work. Price can move against a well-reasoned view, so risk controls are non-negotiable for any trade that follows.
Practice the workflow on Vanto MT5 (demo, or a live account from $25)
Vanto lets you run the full commodity analysis workflow on a demo account with no funds at risk, or on a live account with a $25 minimum deposit. A live account trades real money; a demo account does not. Trade Gold, Silver, and Oil CFDs with raw spreads from 0.0 pips, and a broker that doesn't profit from your losses.
What to evaluate: spreads, execution, and withdrawals
Three things are worth checking: spreads, execution, and withdrawals. The first two can be observed on a demo account with no funds at risk; withdrawals apply to a live account only.
Spreads: The quoted spread on Gold (XAUUSD), Silver (XAGUSD), or oil can be read straight from the MT5 Market Watch during normal hours, and again immediately before a scheduled release like CPI or EIA inventories. Spreads on commodity CFDs typically widen going into that window and narrow again once the release has been absorbed. On a Standard account, FX spreads start from 1.0 pip with no commission. On a Raw account, they start from 0.0 pips but widen during volatility. Recording that widening range gives you a real cost-per-trade benchmark under pressure.
Execution: The news window is where fill quality shows most clearly. Quotes move fast enough that the executed price can differ from the price shown when the order was sent, which is what slippage means. Vanto doesn't profit from your losses. Orders go directly to liquidity providers, with no dealing desk in between, so the target is sub-28ms execution. Slippage during volatility tells you whether that holds in practice, which matters when your stops need to work exactly where you set them.
Withdrawals: On a live account, the time of a withdrawal request is worth recording. Same-day processing is standard on most methods. Check the broker-side processing timestamp in your account history so you can verify it objectively. Fast withdrawal access matters when you need to reduce exposure quickly and can't wait days for funds to clear.
Run the checklist, then review the outcome against the bias
The weekly checklist (macro calendar → supply data → COT positioning → bias) produces a written view. Traders who want to test the workflow commonly log a demo or hypothetical position with a defined stop-loss, then compare the outcome against the pre-trade bias.
Applying the analysis: gold, silver, and oil walkthroughs
The three commodity walkthroughs apply the weekly checklist to real instruments:
Gold (XAUUSD): reading inflation and rate signals
Gold (XAUUSD) has historically been associated with upward pressure when real interest rates fall or inflation expectations climb, and downward pressure when the Fed signals higher-for-longer rates that strengthen the USD. Past correlations do not guarantee future results.
To apply that, you need one concept: real yields. Real yields are the nominal interest rate minus inflation expectations. When real yields rise, gold falls. When they fall, gold climbs.
Rate expectations reprice gold faster than actual Fed decisions. A single CPI surprise or a shift in Fed language can move XAUUSD sharply before any vote is taken.
Here's the three-input checklist for a weekly XAUUSD bias:
-
CPI print direction. A hotter-than-expected CPI triggers immediate repricing of the rate path: markets price in more hikes sooner, real yields jump, and gold sells off. A softer CPI does the reverse, compressing rate expectations and supporting gold. The market moves on the expectation shift, not the eventual decision.
-
FOMC tone (hawkish vs. dovish). Hawkish language (emphasis on staying higher for longer) pushes real yields up and strengthens the USD, both weighing on gold. Dovish signals or a pause in hike language compress real yields and lift gold.
-
DXY trend as the amplifier. Gold is priced in USD, so a rising dollar presses gold lower even when the rate picture is mixed. A weakening DXY amplifies any bullish signal from CPI or FOMC inputs.
Interpretation framework: 3-of-3 alignment is commonly described as a high-conviction analytical lean, 2-of-3 as moderate, and conflicting inputs as neutral. For example: in early 2023, a softer-than-expected CPI print was associated with markets repricing the Fed's rate path lower immediately. The FOMC held rates but dropped its tightening bias in the statement. DXY began trending down the same week. All three inputs aligned bullish. A trader running this checklist would have recorded a high-conviction bullish analytical view on XAUUSD that week. Whether to translate such a view into a trade, and how, depends on individual circumstances. Past patterns do not guarantee future results. When inputs conflict (hot CPI but a weakening DXY), the analytical view is commonly treated as neutral until clarity returns.
Silver (XAGUSD): monetary metal meets industrial demand
Silver (XAGUSD) is a dual-role asset driven by both monetary demand (like gold) and industrial consumption across solar, electronics, and EV sectors.
Silver trades on two separate forces at once.
| Layer | Key inputs | Bullish signal | Bearish signal |
|---|---|---|---|
| Monetary | Fed tone, DXY, real yields | Dovish Fed, falling DXY | Hawkish Fed, rising DXY |
| Industrial | ISM PMI, GDP | PMI above 50 | PMI below 50 |
The monetary side tracks rates and USD just like gold does. The industrial side responds to PMI and GDP data, because physical silver is a key input in solar panels, electronics, and EVs.
Monetary layer: Apply the same rate logic you'd use for gold. When the Fed is hawkish and the DXY is rising, silver's monetary demand weakens. A stronger dollar raises the real cost of holding non-yielding metals, so buyers pull back.
Industrial layer: Check the ISM Manufacturing PMI and major GDP releases. A PMI reading above 50 signals expanding factory activity, which lifts physical demand from manufacturers across:
-
Solar panel production
-
Consumer electronics
-
EV supply chains
A PMI below 50 points the other way, reducing industrial offtake.
When both layers point the same direction, the analytical lean is stronger. Hawkish Fed and weak PMI is a combination historically associated with downward pressure on silver from two sides. Dovish Fed and rising PMI is associated with bullish conditions. When the two layers conflict, the industrial signal is commonly treated as a modifier in analytical frameworks: a bearish monetary setup softens when PMI is climbing, but the monetary side is generally referenced as the primary driver. Past correlations do not guarantee future results.
Oil (Brent/WTI): EIA inventories and OPEC decisions
Oil prices are driven by two primary data inputs: weekly EIA inventory reports (supply signal) and OPEC production decisions (output policy signal).
Three inputs drive the weekly oil bias for Brent and WTI; how to trade WTI crude oil covers the WTI CFD itself. Here's how to score each one before the week opens.
1. EIA inventory report (Wednesday, weekly)
Analytical note: the estimate gap is commonly referenced as the highest-weight weekly signal in fundamental frameworks, not the raw draw or build alone.
A draw in crude stockpiles has historically been associated with bullish pressure. A build has historically been associated with bearish pressure. Past correlations vary by context. The comparison to analyst estimates is commonly weighted more heavily than the headline number because markets price in the expected figure before the release. Prices have often faced selling pressure when the actual draw is smaller than a large forecast, even though supply technically fell. Prices have at times rallied when a build comes in smaller than the bearish consensus.
Here's how to apply it:
-
Draw larger than estimates: bullish
-
Draw smaller than estimates: bearish relative to expectations
-
Build larger than estimates: bearish
-
Build smaller than estimates: bullish relative to expectations
2. OPEC stance
Analytical note: cuts have historically been associated with bullish pressure on oil; output increases with bearish pressure. Surprises typically carry more weight than scheduled decisions in analytical frameworks. Past correlations do not guarantee future results.
Production cuts tighten supply and have historically supported prices. Output increases add supply and have typically been associated with downward price pressure. OPEC+ does not operate on a fixed weekly schedule, so announcements between formal quarterly meetings can come without warning. In analytical frameworks, a surprise cut mid-week is commonly treated as a high-weight signal that may override other inputs. Many traders monitor news alerts for OPEC+ emergency statements.
3. USD and rate environment
Analytical note: a strengthening dollar and hawkish Fed have historically been associated with bearish pressure on oil demand. Past correlations vary by context.
Oil is priced in USD globally. When the dollar rises, oil becomes more expensive for buyers holding euros, yen, or emerging-market currencies, which has typically reduced demand directly. Hawkish Fed expectations have often reinforced this by signalling slower economic growth, which has historically been associated with reduced industrial demand for oil at the source.
Watch DXY direction and any Fed communications that shift rate expectations for the week ahead.
Scoring the three inputs
Here's the framework:
Score each input as bullish, bearish, or neutral. Two or more signals in the same direction produce an analytical lean. The view can be summarised in one sentence before the week opens, e.g.: "Inputs are currently leaning to the downside on oil: EIA showed a surprise build, OPEC held output steady, and USD strength has historically been associated with downward demand-side pressure." Such an analytical view is not a recommendation; whether and how it translates into a trade depends on individual circumstances.
Common questions
What are the 5 key principles of fundamental analysis?
Fundamental analysis rests on 5 core principles:
-
Supply and demand: Price moves when supply and demand fall out of balance. More supply than demand pushes prices down, and vice versa.
-
Economic indicators: Data points like GDP, inflation, and employment shape the broader market environment that assets trade within.
-
Geopolitical events: Wars, sanctions, and elections can disrupt supply chains or shift demand overnight.
-
Central bank policy: Interest rate decisions affect currency values, borrowing costs, and capital flows across markets.
-
Market sentiment: How traders and institutions feel about an asset drives short-term price behaviour, sometimes regardless of the underlying data.
Can you use fundamental and technical analysis together when trading commodities?
Yes, and combining them is a common analytical approach. Fundamental analysis is often used to establish an analytical lean (for example, a bearish view on oil because of rising inventories), while technical analysis is referenced for entry timing at key support or resistance levels. FA describes which inputs are aligned and why; TA describes historical patterns around timing. Whether and how this combined view translates into a trade is an individual decision.
Where can I find free data for commodity fundamental analysis?
Four reliable free sources cover the main commodity drivers:
-
EIA.gov: Weekly oil and gas inventory reports from the U.S. Energy Information Administration.
-
CFTC.gov: Commitments of Traders (COT) reports showing how large speculators and commercials are positioned.
-
Investing.com or TradingEconomics.com: Economic calendars with scheduled data releases across all major markets.
Is fundamental analysis better suited for long-term investing or short-term commodity trading?
FA works for both timeframes, not only for long-term investing. For short-term CFD analysis, FA is commonly referenced for building a weekly analytical view: if supply data leans bearish and the economic backdrop is weak, the analytical view leans short for the week, with TA referenced for entry timing. The analytical view does not need to last months to be useful as a framework input. Whether to trade on such a view, and how, depends on individual circumstances.