Commodity Spread Trading Strategy: How It Works and When to Use It
After testing a few ways to trade the gold-silver relationship on MT5, one approach keeps your exposure cleaner than an outright gold position: trading the ratio between the two metals instead of either one directionally.
Outright XAU/USD trades can get stopped out during wild CPI or NFP weeks even when your metals thesis is completely right. Gold and silver often drop together on broad USD strength or risk-off flows, and your directional stop doesn't care about the reason. A ratio spread changes what you're exposed to. You're no longer asking whether gold goes up. You're asking whether gold gets more expensive relative to silver, and that question produces a more tradable signal when both metals are moving in the same direction.
This guide breaks down what the Gold/Silver ratio actually measures and why it behaves differently from either metal traded alone. It then covers how to set up the spread on VantoTrade MT5 using two simultaneous CFD positions with properly matched lot sizes.
What Is Commodity Spread Trading?
Commodity spread trading is simultaneously buying one futures contract and selling another related contract to profit from changes in the price difference between the two.
Standard directional trading has one goal: price goes up, you profit; price falls, you lose. Spread trading works differently.
Instead of betting on one instrument moving in a single direction, you hold two opposing positions simultaneously. One leg is long, one is short. Profit comes from the differential between the two positions narrowing or widening, not from the outright market level.
For CFD traders, this means opening two correlated positions at once. A basic example: short XAU/USD and long XAG/USD when the Gold/Silver ratio is elevated. If silver strengthens relative to gold, the ratio compresses and the trade profits, even if both metals fall in absolute terms.
Two contracts are 'related' when there is a logical economic or structural reason for their prices to move together. The pairing is not arbitrary.
Relationships fall into two categories:
-
Calendar spreads - the same commodity in two different delivery months (e.g., July crude oil long vs. December crude oil short). The spread reflects seasonal demand, storage costs, and supply expectations between those dates.
-
Inter-commodity spreads - two different but economically linked markets. Gold and silver are the clearest example: both are precious metals, both react to USD strength and risk sentiment, and both trade with high liquidity during London and New York sessions on VantoTrade.
The Gold/Silver pair (XAU/USD vs. XAG/USD) is the primary focus here. Brent Crude (available on VantoTrade) is a relevant option for traders ready to go further.
How Does a Spread Trade Work?
A spread trade works by simultaneously holding a long position in one futures contract and a short position in a related contract, so profit or loss depends on how the price difference between the two changes, not on overall market direction. The two legs partially offset each other, which reduces directional risk and lowers margin requirements compared to a single outright position.
Say you buy December corn futures at $4.20/bushel and sell March corn futures at $4.45/bushel. The spread at entry is -$0.25 (long leg minus short leg). You're not betting on corn going up or down. You're betting that the price gap between those two contracts will change.
Calculating the Spread Value
Spread value is the price of the long contract minus the price of the short contract, and your profit or loss is determined by how that difference changes after you enter the trade.
If December rises to $4.40 while March stays at $4.45, the new spread is -$0.05. The spread narrowed by $0.20/bushel in your favor. Multiply that by contract size and that's your profit, regardless of where corn prices ended up in absolute terms.
The same logic applies to inter-market spreads. When the Gold/Silver ratio climbs above 75-80, gold is historically expensive relative to silver. A spread trade here means going short XAU/USD and long XAG/USD, expecting the ratio to compress back toward its mean. Profit comes from the ratio narrowing, not from either metal moving in any particular direction.
Three things push spread values around, independent of where outright prices are heading:
-
Front-month momentum - in strong trending markets, the near-term contract moves faster and further than deferred months, widening or narrowing the gap between them
-
Seasonal factors - crop harvest cycles, energy demand peaks, and weather patterns affect nearby contracts differently than contracts further out
-
Storage and carry costs - the cost of holding a physical commodity (warehouse fees, financing) shapes the price premium between contract months and can shift without any change in the outright trend
Margin Requirements and Execution
Spread trades carry significantly lower margin requirements than equivalent outright futures positions because the two legs partially offset each other's risk, as recognized by exchanges and brokers in their margin calculations.
In futures markets, exchange-recognized margin offsets make spread trading noticeably cheaper. A December corn futures outright position requires roughly $1,073 in margin. Structure that same exposure as a December/March spread and the margin drops to approximately $303, because two partially offsetting legs carry less net directional risk.
CFDs work differently. There are no exchange-recognized margin offsets, so both legs are margined independently at the full per-position rate.
MT5 has no linked spread order type. Place both legs as separate market or limit orders in the same session to keep your exposure as intended. Use a Raw account for tighter per-leg spreads, which lowers the cost of carrying two open positions simultaneously.
-
Open MT5 and go to the Trade tab.
-
Right-click the first contract (e.g., XAU/USD) and select New Order. Set direction, lot size, and price, then confirm.
-
Immediately open a New Order for the second contract (e.g., XAG/USD) in the opposite direction with the matched lot size.
-
Confirm both orders are active in the Trade tab before the session moves against you.
-
Monitor and close each leg separately when exiting the position.
Contango, Backwardation, and Seasonal Patterns
The shape of a futures curve tells you something concrete about supply and demand right now. Whether it slopes upward (contango) or downward (backwardation), that structure and recurring seasonal demand cycles are the primary forces that create predictable spread trading opportunities in commodity markets.
What Is Contango?
Contango is a futures market condition where contracts with later expiration dates are priced higher than the current spot price or near-term contracts.
Deferred contracts cost more in contango because holding a physical commodity until delivery is not free. Storage, insurance, and financing all add up. In energy markets, contango often signals oversupply: storage tanks fill up, spot prices fall, and forward prices stay elevated to cover those carry costs.
CFD traders feel this as overnight swap charges. Holding a long commodity CFD when near-term supply is ample means paying a nightly carry fee that mirrors futures contango. On a standard XAU/USD lot, those charges compound quickly across a multi-day hold. Check both the long and short swap rates in MT5 before holding overnight: right-click the instrument, select Specification, and read the numbers before you commit.
Spread traders in a contango market buy the near-month contract and sell the deferred one. As expiry nears, carry costs ease and the deferred premium narrows. That compression is the profit, not a directional bet on price.
Here is a simple corn example. You buy December corn at $4.20 and sell March corn at $4.45, entering at a -$0.25 spread. If the spread narrows to -$0.05 by expiry, you pocket $0.20 per bushel regardless of where outright corn trades. The position wins on the structure of the market, not on guessing up or down.
What Is Backwardation?
Backwardation is a futures market condition where near-term or spot prices are higher than contracts with later expiration dates, the inverse of contango.

| Contango | Backwardation | |
|---|---|---|
| Futures curve shape | Upward slope (deferred > near) | Downward slope (near > deferred) |
| Typical cause | Oversupply, high carry costs | Tight supply, high immediate demand |
| Spread trade direction | Buy near, sell deferred | Sell near, buy deferred |
| CFD implication | Higher overnight swap costs on longs | May signal sharp directional move |
| Risk to watch | Carry cost erosion on multi-day holds | Momentum can widen spread before reversion |
Backwardation flips that dynamic. High immediate demand or tight physical supply makes the commodity right now worth more than deferred delivery, so front-month contracts trade above later months.
Agricultural markets show this clearly. Wheat or corn can enter backwardation before harvest when current stocks are running low, even if a large crop is weeks away. Energy markets can go further: during the 2021-2022 energy crisis, natural gas entered deep backwardation with front-month contracts trading $2-3/MMBtu above deferred months, coinciding with a front-month price rally of over 150%.
The spread trade reverses in backwardation: you sell the near-month contract and buy the deferred one, then profit if the spread narrows toward expiry. The setup is straightforward, but the environment is not. Backwardation signals tight physical supply, which often means prices are rising sharply, and that momentum can widen the spread further before it narrows.
For CFD traders holding spread positions overnight in energy markets, swap costs on both legs can shift during periods of acute backwardation. Check the swap rates on each contract before holding overnight, not just at entry. Seasonal patterns explain why certain commodities enter backwardation on a predictable schedule.
Seasonal Spread Patterns
Seasonal spread patterns are recurring, predictable price relationships between commodity futures contracts driven by planting cycles, harvest timing, storage dynamics, and consumption trends.
Agricultural commodities show the strongest seasonal spread patterns of any asset class. Corn, wheat, and soybeans all run on fixed planting and harvest calendars, so supply shifts follow a predictable annual rhythm that shows up consistently in futures spreads year after year.
Energy markets move on demand cycles instead: heating oil tightens in winter, gasoline spreads shift ahead of the summer driving season. Moore Research Center (MRCI) is the standard reference for historical seasonal data, covering decades of futures price behavior across both agricultural and energy markets.
The old-crop/new-crop corn spread is a textbook example. A trader buys the July contract and sells December before harvest, expecting old-crop supply to tighten as stocks run down into the new season, widening the spread between the two contracts.
The heating oil winter seasonal works the same way: buy the front-month contract in autumn, sell the deferred month, and wait for winter demand to pull near-term prices higher relative to later delivery.
Seasonal tendencies repeat because the underlying supply and demand drivers repeat. But anomalous weather, policy changes, or demand shocks can break any pattern in a given year, so these tendencies inform context rather than replace risk management.
On instruments VantoTrade traders commonly use: Gold shows relative strength in Q1 (January-February, tied to Asian New Year demand flows) and again in September. The Gold/Silver ratio tends to compress mid-year during risk-on conditions as silver outperforms. Brent Crude sees supply-driven spread moves in Q2-Q3. Treat these as background tendencies only, not trade signals. Understanding where seasonal bias sits helps you read the main spread types with sharper context.
Main Types of Commodity Spread Strategies
Commodity spread strategies fall into three categories. Calendar spreads trade the same commodity across different delivery months. Inter-commodity spreads trade different but related commodities. Bull and bear structures add a directional bias to either setup.
| Strategy type | What's traded | Direction | Best for |
|---|---|---|---|
| Calendar spread | Same commodity, different delivery months | Long near / Short deferred (or reverse) | Futures traders with exchange margin offsets |
| Inter-commodity spread | Two related commodities (e.g., Gold vs. Silver) | Long one / Short the other | CFD retail traders, the practical starting point |
| Bull spread | Same commodity, different delivery months | Long near / Short deferred | Expecting front-month to outperform |
| Bear spread | Same commodity, different delivery months | Short near / Long deferred | Expecting front-month to underperform |
Calendar (Intra-Commodity) Spreads
A calendar spread is a futures position that buys one delivery month of a commodity and simultaneously sells a different delivery month of the same commodity.
A calendar spread pairs two contracts on the same commodity at different expiry dates. Using the corn example from earlier (December at $4.20, March at $4.45), the trader profits from how the $0.25 gap changes over time, not from corn moving in any direction.
In practice, calendar spreads require fixed-expiry futures contracts. VantoTrade offers rolling contracts only, so holding December corn and March corn simultaneously is not possible. Retail CFD traders should skip this structure. The inter-commodity spread (Gold vs. Silver) is the practical equivalent and the format covered in this guide.
Calendar spread P&L doesn't move with the commodity's overall price. Because you're long one contract and short another, broad price shifts in corn (or oil, or gold) largely cancel out between the two legs.
Profit comes from the differential itself narrowing or widening in the expected direction. If you expected the spread to move from -$0.25 to -$0.15, that $0.10 change is your gain. The absolute price of corn is secondary.
Inter-Commodity Spreads
An inter-commodity spread is a futures position that buys one commodity and simultaneously sells a different but economically related commodity, trading the price relationship between the two.
Two commodities are considered related when their prices move together due to a shared economic link. Substitute commodities like corn and wheat compete for the same end use, so buyers shift between them when prices diverge. Input-output pairs like crude oil and gasoline are connected by the supply chain: one is the raw material, the other is the finished product.
Because the relationship is structural, the ratio between two related commodity prices tends to be more predictable than either price on its own. Spread traders focus on that ratio, not the direction of the underlying market.
Three inter-commodity spreads are most widely traded:
-
Crack spread - crude oil vs. refined products (gasoline, heating oil), reflecting the refinery profit margin
-
Crush spread - soybeans vs. soybean oil and soybean meal, reflecting the processing margin
-
Gold/Silver ratio - both precious metals, driven by USD strength and risk sentiment
For retail CFD traders, the Gold/Silver ratio is the practical choice, and the mechanics overlap closely with commodity pair trading. Crack and crush spreads require futures accounts and are largely institutional territory. Both Gold and Silver are available on VantoTrade and stay liquid through the London and New York session overlap.
Bull and Bear Spread Structures
Bull and bear spread structures are directional calendar spreads: a bull spread buys the near-month contract and sells the deferred month; a bear spread does the opposite.
In a bullish market, the front-month contract rises faster and further than back-month contracts. Near-term demand pressure or supply tightness is the driver: traders bid up the closest delivery date hardest, while deferred months lag behind.
Buying the near month and shorting the deferred captures this. The spread (near price minus deferred price) narrows or inverts, and that movement is your profit. You are not betting on price direction alone. You are betting that right-now conditions are tighter than conditions six months from now.
A bear spread reverses the position: sell the near month, buy the deferred. It profits when the front month falls faster than the back month, widening the spread in the seller's favour. The typical setup is ample near-term supply or softening demand, which pushes the closest delivery date down while later months hold relatively firm.
In CFD terms, the same logic applies across correlated instruments. A bull spread on Gold/Silver means long XAU/USD and short XAG/USD, expecting gold to outperform silver and the Gold/Silver ratio to rise. A bear spread is the reverse: short XAU/USD and long XAG/USD, expecting silver to outperform.
Sizing is where traders get caught. One standard lot of gold and one standard lot of silver carry very different notional values, so matching lot size is not enough. You need to match dollar value per leg to keep the spread balanced. Before placing either structure, check the risk parameters covered in the next section.
Why Spread Trading Offers Lower Risk - and Where It Doesn't
Spread trading reduces risk because correlated contract legs partially offset each other's price moves, but that protection fails when correlations break down, spreads blow out, or positions are over-leveraged. A solid risk analysis framework is essential before sizing any spread position.
Spread trading reduces risk because both legs respond to the same broad market forces. When gold and silver both sell off on weak economic data, the long gold leg loses value, but the short silver leg gains. The trade is roughly delta-neutral: directional moves cancel out, leaving only the relative price difference as your exposure.
Here's a concrete example. Gold drops $80 per troy ounce and silver drops $3 per troy ounce in the same session. Your long gold position loses $80. Your short silver position gains the equivalent of $3 per ounce. Depending on your position sizing, the net result is a small gain or a near-zero loss, not the full $80 hit you'd take on an outright gold long.
Three conditions can break the offset and turn a spread trade into a losing position on both legs. The first is correlation breakdown. If a supply shock hits only gold, or only the nearby contract month, the two legs stop moving together. Both legs can then move against you at the same time.
The second is spread blowouts during thin liquidity windows. In low-volume sessions or during flash crashes, bid-ask spreads on both gold and silver can widen sharply. Exiting both legs at a fair price becomes expensive or impossible.
The third is over-leveraging. Lower margin requirements on spreads make it easy to size up. But a larger position amplifies every pip of spread divergence, particularly in volatile commodities during major releases like NFP or Fed decisions. There is also a CFD-specific cost to count before you enter: each leg carries its own bid-ask spread. You pay twice to get in and twice to get out. For strategies targeting small differential moves, this double cost can erase the expected gain before the trade even has a chance to work.
There is a less obvious statistical risk as well. Calendar spreads in particular tend to exhibit higher kurtosis (fat tails) than outright futures positions. That means extreme, unexpected spread blowouts occur more frequently than a normal distribution would suggest. The March 2020 Gold/Silver ratio spike from 85 to above 120 in under three weeks is one example of a fat-tail event that caught spread traders off guard.
Margin calls are the structural danger that catches CFD spread traders off guard. On a single directional trade, a margin call closes your position. On a spread, it can break the hedge entirely.
Here is how it happens. A sharp move hits one leg hard. Free margin on that ticket drops below the broker's minimum. The broker auto-closes that leg. Now you are left holding the other leg with no offset, and what was a hedged spread position becomes a naked directional trade. The combined P&L may have looked fine right up until the close.
The fix is straightforward. Watch free margin on each ticket separately, not just your overall account balance. If one leg is getting squeezed, add margin or reduce that position before the broker acts for you. Combined P&L is not a reliable warning sign here. Per-ticket margin is.
When Spread Trading Works - and When It Doesn't
Spread trading works best when volatility is high and the correlation between related contracts is intact. It struggles when correlations break down or when price differentials remain static in low-volatility environments.
Volatility is the spread trader's best friend.
High volatility widens spread differentials, creating larger moves between related contracts. Seasonal transitions are some of the most reliable windows in energy markets: the shift from winter heating oil demand to summer gasoline demand follows a predictable calendar that repeats year after year. Supply disruptions, such as OPEC production cuts or drought affecting crop yields, widen the gap between nearby and deferred contracts by more than a straight directional move would.
The exception: flash crashes and thin liquidity outside the London/New York session overlap. During these windows, Gold and Silver can spike hard in the same direction at once, stripping away the hedge entirely. If a spread position starts behaving that way, close both legs immediately. Do not wait for reversion.
Correlation breakdown means both legs move against you at the same time.
The March 2020 COVID crash is the clearest example. The Gold/Silver ratio spiked from around 85 to above 120 in under three weeks. Traders holding a short Gold / long Silver spread saw losses on both legs: Silver fell faster and further than Gold, so the long Silver leg lost money while Gold also declined. The ratio eventually compressed back below 70 by mid-2020. But traders who were stopped out during the spike never captured that recovery. The position effectively became two directional bets with twice the exposure, which is the opposite of what a spread is supposed to do.
Flat markets don't just reduce returns for spread traders. They eliminate the opportunity entirely.
A spread profits when the differential between two legs changes. If both contracts drift in the same direction at the same pace, the differential stays static and there is nothing to capture. A directional trader can profit from any large move, up or down. Spread traders need divergence. No divergence means no trade, regardless of how well the underlying correlation holds.
Run through this checklist before entering any spread position:
-
Confirm both instruments are in a high-liquidity session. For Gold and Silver, this means the London/New York overlap window.
-
Check the current Gold/Silver ratio against its 1-year range. A ratio near a historical extreme is a stronger setup than one in the middle of its range.
-
Verify swap costs on both legs before planning any overnight hold. Carry costs can erode spread profits quietly.
-
Confirm no major macro event is due within your holding period. FOMC and NFP releases can force simultaneous moves in both legs, temporarily breaking correlation.
-
Check whether a seasonal catalyst is approaching. Spread moves tend to be sharpest when a catalyst forces repricing of one leg relative to the other.
If you cannot confirm the London/New York overlap window for Gold or Silver, wait for the next session before entering.
How to Apply Commodity Spread Concepts Using CFDs
Apply commodity spread concepts with CFDs by opening two opposing CFD positions on correlated instruments (e.g., long WTI crude, short Brent crude) and managing the net exposure between them rather than directional price movement.
Inter-commodity pairs are the practical choice for CFD spread traders. Gold vs. Silver is the most accessible: both trade around the clock, share a well-documented substitution relationship, and the ratio is widely followed. Brent crude is a viable advanced option if you want exposure to oil-market dynamics.
Calendar spreads are not possible on VantoTrade. The platform uses rolling contracts only, so there is no way to hold December and March of the same commodity simultaneously. Crack and crush spreads fall into institutional futures territory and require margin structures CFD accounts do not support.
For most retail traders, Gold vs. Silver is the right starting point. The instruments are liquid, the ratio is easy to track, and both are available on a single MT5 account.
CFD traders get no exchange-recognized margin offsets for spread positions. Each leg is margined independently at the full rate, so two open positions require two separate margin deposits running at the same time.
With 1:100 leverage, a $10,000 Gold position requires $100 in margin. A simultaneous Silver short requires its own margin deposit. Both run in parallel for the duration of the trade.
A Raw account reduces the running cost of carrying both legs. Tighter per-leg bid-ask spreads compound favorably over a multi-day hold compared to a Standard account, where wider spreads eat into the spread trade's edge from day one.
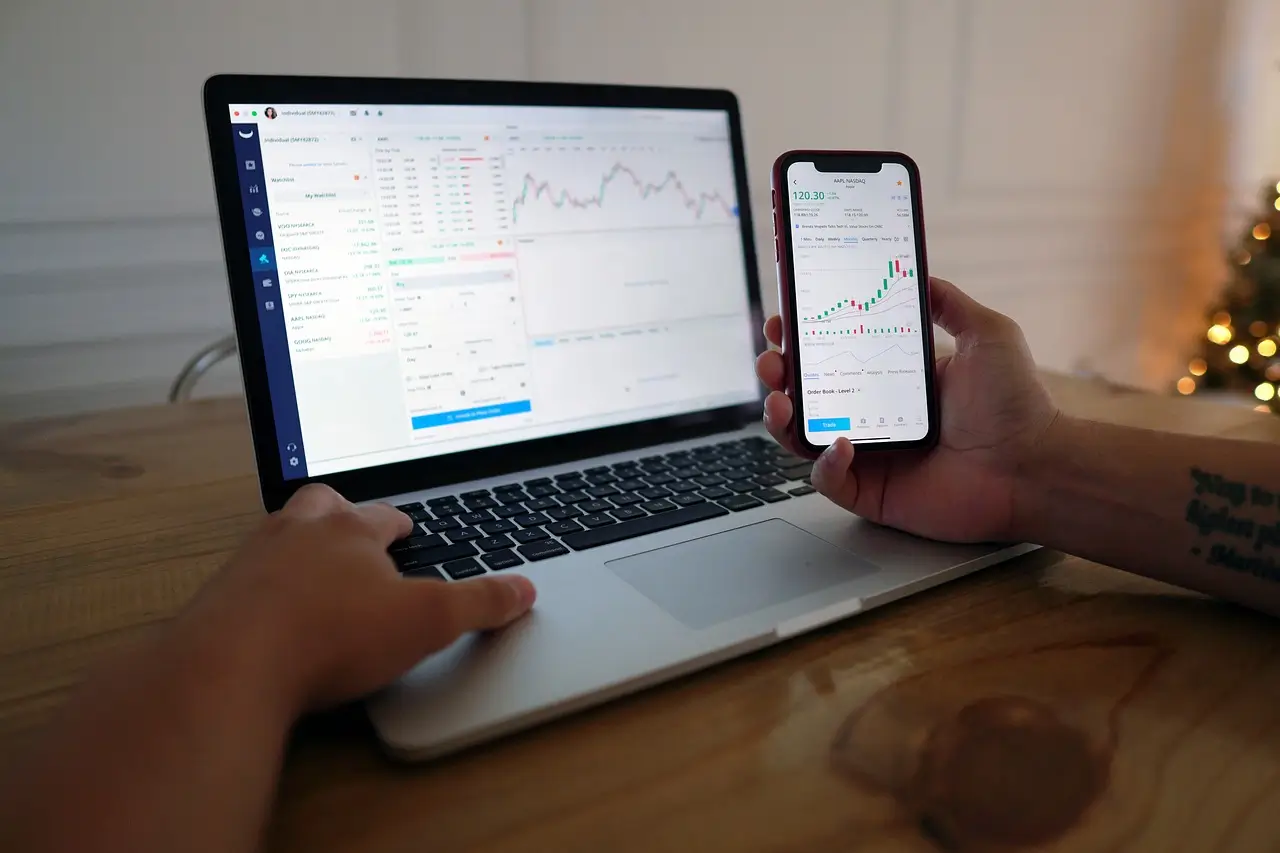
Track the Gold/Silver ratio (XAU/USD price divided by XAG/USD price), not the individual P&L of each ticket. A spread trade profits when the ratio moves in your favor, so watching each leg in isolation will mislead you.
On VantoTrade MT5, each leg is placed as a separate order. Open both instruments in the same terminal session to minimize the time between fills. MT5's multi-chart layout lets you display Gold and Silver side by side throughout the trade.
For ratio charting, use TradingView: plot XAUUSD/XAGUSD as a single chart to see entry and exit levels clearly. Then execute all orders through VantoTrade MT5.
Once you know which pair to trade and how to track the ratio, the next step is placing both legs. Here is how to execute the Gold/Silver spread on VantoTrade MT5.
How to Execute a Commodity Spread Trade
Executing a commodity spread trade means simultaneously buying one contract and selling a related one, focusing on the price differential between the two legs rather than outright price direction. On VantoTrade MT5, both legs are placed as separate orders in the same session, with no linked spread order type. The process covers selecting the right spread, placing both legs as quickly as possible, and managing the position within defined risk parameters.
Tight spreads on Gold and Silver keep the entry cost of each leg low, which matters specifically for spread trading where you are paying twice, once for each leg. VantoTrade's A-Book model routes orders directly to liquidity providers, so there is no dealing desk widening your fills. What you see on the platform is what you get in the market. For traders testing this strategy for the first time, VantoTrade's demo account runs on the same MT5 infrastructure as live accounts with no time limit, so you can validate the Gold/Silver ratio setup without risking real capital.
Use TradingView to chart the Gold/Silver ratio (XAUUSD/XAGUSD) and spot entry signals. Execute all orders through VantoTrade MT5.
Because MT5 treats each leg as an independent order, place both market orders back-to-back in the same session. Slowing down between legs creates timing risk.
Choosing and Setting Up Your Spread
For Gold/Silver spreads on VantoTrade MT5, the setup involves four steps: identify the ratio extreme, size each leg by dollar notional, place both orders back-to-back as fast as possible, and set a ratio alert for your exit target.
For VantoTrade CFD traders, Gold/Silver (XAU/USD vs XAG/USD) is the practical starting point. Both instruments are liquid during the London/New York overlap, keeping spreads tight and fills reliable. COMEX gold averages roughly 165,000 contracts in average daily volume with 380,000 open interest, and silver maintains similarly deep institutional liquidity, and that depth carries through to CFD pricing.
Avoid calendar spreads entirely: VantoTrade CFDs roll automatically, so there is no back-month contract to trade against. Avoid thin instruments like palladium, where wide spreads eat into any ratio gain.
Run through these four checks before placing the trade:

-
Check the ratio. If the Gold/Silver ratio is above 75-80, gold is historically expensive relative to silver. That is your signal to buy silver and sell gold, expecting the ratio to compress back toward its long-term average of around 65.
-
Size by dollar notional, not lots. One standard lot of Gold (approx. $480,000 notional at current prices) requires roughly 1.3 lots of Silver (approx. $375,000 notional per lot) to match dollar exposure per leg.
-
Set a target alert. Place a ratio alert at your target level as a profit signal. For a mean-reversion trade from 75, a target around 68-70 is reasonable.
-
Define your stop. A 3-5 point move against your position is a reasonable exit trigger. On standard lot sizing, a 5-point ratio move produces significant P&L, so calculate the exact figure against your notional before entering.

| Gold (XAU/USD) | Silver (XAG/USD) | |
|---|---|---|
| Direction (ratio compression) | Short | Long |
| Standard lot size | 100 oz | 5,000 oz |
| Approx. price (Mar 2026) | ~$4,800/oz | ~$75/oz |
| Notional per lot | ~$480,000 | ~$375,000 |
| Lots needed to match notional | 1 lot | ~1.3 lots |
| Margin (Raw acct, 1:100) | ~$4,800 | ~$4,875 (1.3 lots) |
In MT5, open the Gold ticket first, then the Silver ticket immediately after. There is no combined order type, so speed matters. A gap of several seconds between legs is a gap in your hedge.
When exiting, close each leg separately. Profit and loss comes from the change in the ratio between legs, not from outright price movement. If Gold and Silver move equally in the same direction, the position stays flat.
Mini example (Gold/Silver ratio mean-reversion): Gold is at $4,800, Silver at $64 (hypothetical). The ratio is 75, above the historical average. You expect the ratio to compress. You go short 0.1 lot XAU/USD (10 oz) and long 0.13 lots XAG/USD (650 oz), matching dollar notional on both legs. Over two weeks the ratio compresses to 70. Gold falls from $4,800 to $4,760 (-$40/oz), and Silver rises from $64 to $68 (+$4/oz). Your short gold leg gains $40 × 10 = $400. Your long silver leg gains $4 × 650 = $2,600. Net P&L on the ratio move: approximately +$3,000, before swap costs on both legs.
Common Mistakes to Avoid
Four mistakes account for most losses in gold/silver spread trading on MT5:
-
Legging risk - the timing gap between your first fill and your second
-
Ignoring seasonality and contract specs - entering against the trend or mismatching lot sizes
-
Over-leveraging on assumed lower risk - treating lower margin as permission to size up
-
Tracking absolute price instead of the differential - watching individual tickets instead of the ratio
Legging risk is what happens between the moment your first order fills and the moment you place the second. That gap leaves you holding an unhedged directional position in gold or silver, not a spread.
Both legs must be placed manually and back-to-back in the same session since there is no combined spread order on MT5. The faster you move between fills, the less exposure you carry.
Seasonal trends affect the gold/silver ratio at predictable points in the year. Entering against that trend without a clear counter-thesis reduces the probability the differential moves your way.
Mismatched lot sizes create a second problem. Sizing by lots instead of dollar notional means the two legs don't carry equal weight. One side moves more than the other, and the trade stops being a spread.
Lower margin on a spread reflects lower volatility between the two legs, not lower potential loss. If the gold/silver ratio moves sharply against you, losses can exceed your initial margin just as with any outright position.
Swap costs add a CFD-specific layer that standard spread guides rarely mention. Both XAU/USD and XAG/USD carry overnight swap charges independently. On a multi-day hold, those charges compound on both legs simultaneously.
Before holding overnight, check the swap rate for each instrument in MT5 (right-click the instrument, then select Specification). If the combined daily swap cost exceeds your expected move in the ratio, the trade is not worth carrying.
Amaranth Advisors built calendar spread positions so large they held 81% of NYMEX natural gas open interest at peak. When spreads reverted, there was no exit. The fund lost $6.6 billion in a single month in 2006. Position size turned a directional view into an irreversible one.
For CFD traders, the same trap scales down to single-account level. Size each leg so a 10-point adverse move in the ratio stays within your pre-defined risk limit per trade. On positions held multiple days, swap costs accrue on both legs simultaneously. An oversized spread held for a week can bleed more in swap fees than the ratio ever moved in your favour.
Your P&L comes entirely from the change in the price differential, not from what either leg does on its own. If gold rises $10 and silver rises by an equivalent dollar amount, P&L is zero.
Watching individual position tickets will mislead you. Track the gold/silver ratio directly. That number tells you whether the trade is working.
Spread trading costs you twice. You pay the bid-ask spread on both legs when you open, and again when you close. On Gold and Silver, those costs add up fast. A VantoTrade Raw account brings spreads from 0.0 pips on both metals, with a flat $3.50 commission per lot per side. That's a known, fixed cost you can factor into your setup before you place a single order.
Test the Gold/Silver ratio setup on a demo account before putting real capital at risk. VantoTrade's demo runs on the same MT5 infrastructure as live accounts, with no time limit. Open both legs, track the ratio, and get comfortable with how the trade moves. Fund when you're ready.
Common Questions About Commodity Spread Trading
What Is the Best Strategy for Commodity Trading?
Commodity spread trading is a strategy involving the simultaneous purchase and sale of two related futures or CFD contracts to profit from their price differential.
Spread trading generates profit when the price gap between two related assets narrows or widens as predicted, regardless of which direction the broader market moves. You're not betting on gold going up or down. You're betting on the relationship between two prices changing.
There is no single best strategy. The right approach depends on your risk tolerance, available capital, and how much time you can spend monitoring positions. For a broader view, see our commodity trading strategies overview. Calendar spreads suit futures traders who benefit from exchange margin offsets. Inter-commodity CFD spreads, like Gold vs. Silver, suit retail traders who want relative-value exposure without full directional risk.
On VantoTrade, commodities support up to 1:100 leverage, so a $100 margin deposit controls a $10,000 position. The same leverage that amplifies gains amplifies losses by the same amount. Size positions accordingly.
Two types of commodity spreads are common. Intra-commodity spreads use the same asset across different delivery months, for example, buying December crude oil and selling March crude oil. Inter-commodity spreads use two related but different assets, like going long Gold and short Silver.
For CFD traders, inter-commodity spreads are the practical choice. Most CFD brokers offer a single rolling contract per commodity, which rules out trading two expiry months on the same asset simultaneously.
Do You Need a Futures Account - or Can You Use CFDs?
A futures account is required for authentic calendar spread trading, while CFDs are suitable for simpler inter-commodity spread strategies.
Calendar spreads require holding two contracts on the same commodity with different expiry dates at the same time. Most CFD brokers offer only one rolling contract per commodity, so that structure is not available.
For Gold/Silver spread trading, CFDs are still sufficient. You get the same relative-value exposure: long one commodity, short a related one, without managing contract expiry or delivery risk. The tradeoffs are real: no exchange margin offsets, and swap costs replace the futures roll cost. For retail traders, that's an acceptable trade.
CFD accounts remove the operational friction of futures trading: no expiry dates to roll, no delivery risk, and no large minimum capital requirements. If you are new to this market, start with our commodities trading for beginners guide. On VantoTrade, you can open an account with a $25 minimum deposit and trade commodities with up to 1:100 leverage.
That accessibility cuts both ways. A $100 margin controls a $10,000 position, which means a 1% move against you wipes the margin. Start small until the strategy proves itself.
Which Commodities Are Most Common for Spread Trading?
Energy commodities like WTI crude oil and natural gas are the most common for spread trading, followed by agricultural products and metals.
Natural gas and WTI crude dominate futures spreading activity. Natural gas accounts for 44.2% of total open interest in spreading positions, with WTI crude at 36.1%. In metals, gold leads with 74,125 spreading contracts and copper follows at 33,976.
For retail CFD traders, Gold (XAU/USD) and Silver (XAG/USD) are the most accessible, with tight spreads and strong liquidity during the London and New York sessions. Brent Crude works for experienced traders comfortable with energy-market volatility. Avoid palladium because the bid-ask spreads are wide enough to absorb any edge before a trade even moves in your favour.
Are Spread Margins Lower Than Outright Futures?
Spread margins are systematically lower than outright futures margins because exchanges apply risk-based offsets for correlated positions that exhibit lower volatility.
Futures exchanges typically grant 50-85% margin offsets for eligible spread positions. Intra-commodity calendar spreads can carry margins as low as 10-25% of a single outright leg.
WTI calendar spreads require roughly $500-$2,000 in margin versus $6,000+ for an outright futures position. CFD traders get none of this. Both legs are margined at the full rate independently, so budget for the combined margin of both legs plus a buffer. Without that buffer, a margin call can close one leg early and leave you with an unhedged position.
What Are the Most Reliable Seasonal Spread Patterns?
Seasonal spread patterns are recurring price differences between related futures contracts driven by annual cycles in supply, demand, and production schedules.
Corn and soybean prices bottom during fall harvest in roughly 9 out of 10 years as supply gluts hit the market. Natural gas spreads follow a different clock: backwardation during winter heating demand, then contango through summer injection seasons. These patterns repeat reliably because weather and harvest schedules don't change. Anomalous years happen, though, and one drought or a warm winter can invert the whole setup.
On VantoTrade instruments, Gold tends to show strength in Q1 (January–February) from Asian New Year demand, then again in September. The Gold/Silver ratio compresses mid-year as Silver outperforms during risk-on periods. Brent Crude sees the most active spread moves in Q2–Q3, driven by supply-side shifts. These are background tendencies to read against, not entry signals.