Commodity trend following is one of the oldest systematic strategies in trading. Commodity Trading Advisors have run it at institutional scale for decades, and retail traders using CFDs can apply the same core logic from a single account.
The concept sounds straightforward: identify a sustained price trend in gold, oil, or natural gas, enter in the direction of that trend, and hold until the move exhausts itself. In practice, most beginners skip the structural layer, including position sizing rules, entry filters, and the discipline to cut losses when a trend reversal signals it's time to exit.
That gap between the idea and the execution is where accounts get damaged.
This guide covers how commodity trend following works, which instruments suit it best on CFDs, how to build a rules-based entry and exit framework, and how to size positions so a losing streak doesn't wipe out the gains from a single good trend.
What Is Commodity Trend Following?
Commodity trend following is a trading strategy that identifies an existing price trend in commodity markets and holds positions in that direction until the trend reverses.
Trend following works in both directions. When Gold is in a sustained uptrend, you go long. When prices are falling, you go short. A prolonged drop in Gold prices is just as tradeable as a rally.
CFDs make this straightforward. You don't need to own physical Gold or Silver to profit from a downtrend. You simply open a short position and close it when the trend reverses.
At the institutional level, trend following is the core strategy of Commodity Trading Advisors (CTAs). Firms like Man AHL and Winton Group have run systematic commodity trend programs at scale for decades.
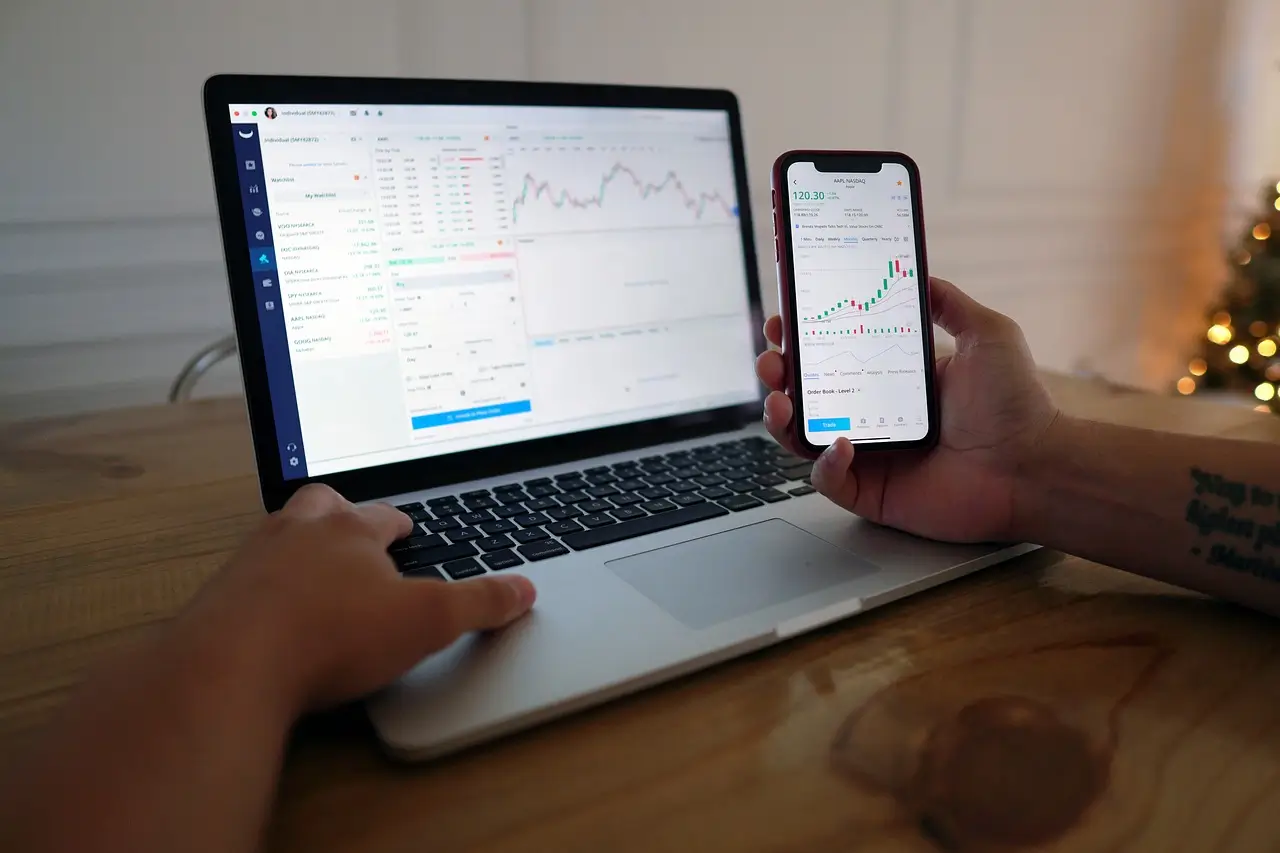
Retail traders apply the same logic through commodity CFDs. On MT5, traders can run trend-following strategies on Gold (XAUUSD), Silver (XAGUSD), and Oil using technical indicators to identify trend direction and time entries.
How Trend Following Compares to Other Approaches
Trend following holds positions for days to months to capture sustained directional moves. Scalping holds for seconds to minutes, targeting small frequent gains from rapid entries and exits.
Scalping and trend following differ most on holding time. Scalpers open and close positions within seconds to minutes. Trend followers hold trades for days to months, riding a sustained directional move.
| Scalping | Trend Following | |
|---|---|---|
| Holding time | Seconds to minutes | Days to months |
| Typical win rate | Higher (60-70%+) | Lower (30-50%) |
| Target per trade | 2-10 pips | 50-200+ pips |
| Spread sensitivity | High - spread is a large % of target | Lower - spread is a small fraction of target |
| Position monitoring | Active, eyes on screen | Rules-based; price alerts sufficient |
Spread cost hits each style differently. A scalper targets small moves, often 2-5 pips, so a 1-pip spread takes a significant slice of the expected gain. Raw spreads matter more on a per-trade basis. For a complete scalping setup on gold, see the 5-minute gold scalping strategy.
A trend follower targets moves of 50-200+ pips, so the spread is a smaller fraction of the target. Even so, spread costs accumulate across the full run of a trend and across many trades over a year.
Win rate and payout structure are also different. Scalping tends to produce higher win rates, with frequent small gains offsetting frequent small losses. Trend following typically wins fewer than half of all trades. The math still works because the winning trades are large enough to cover many small losses and still return a net profit.
That math works best when price moves in clear, sustained directions. Commodity markets have structural reasons to do exactly that.
Why Commodities Suit Trend-Driven Trading
Commodities suit trend-driven trading because supply-demand imbalances, seasonal cycles, and geopolitical disruptions push prices into extended directional moves that trend systems can capture.
Commodity prices move on physical necessity, not sentiment. When a drought cuts wheat supply or a pipeline shuts down, the price response is mechanical and often sustained for weeks to quarters.
A single earnings call can reverse an equity position overnight. The same shock rarely resolves a drought, a pipeline shutdown, or an OPEC cut that fast.
Four commodity markets show this pattern consistently:
-
Crude oil - OPEC supply cuts have historically triggered multi-month rallies as the market reprices a tighter supply curve
-
Natural gas - winter heating demand creates a predictable seasonal trend each year, with prices rising sharply as northern hemisphere temperatures drop
-
Wheat - drought conditions can drive a directional move that lasts an entire growing season, since supply losses can't be recovered mid-cycle
-
Gold - during risk-off cycles, sustained capital flows into gold create extended uptrends that can run for quarters
The Bloomberg Commodity Index tracks a broad basket of these markets and is commonly used as a benchmark for evaluating commodity trend performance over time.
XAUUSD (gold), XAGUSD (silver), and UKOIL (crude) are all available on VantoTrade's MT5 platform.
| Instrument | VantoTrade Symbol | Primary Catalyst | Typical Trend Duration |
|---|---|---|---|
| Gold | XAUUSD | CPI, NFP, FOMC, risk-off flows | Weeks to quarters |
| Silver | XAGUSD | Industrial demand, gold correlation | Weeks to months |
| Oil (Brent) | UKOIL | EIA/API inventories, OPEC decisions, geopolitics | Days to weeks |
| Natural Gas | Available on MT5 | EIA storage report, seasonal heating demand | Days to weeks (high volatility) |
Commodities also offer a structural diversification benefit. Energy, metals, and agricultural markets have near-zero correlation to equities during crisis periods, meaning commodity trends can generate returns precisely when stock portfolios are under pressure.
Historically, commodities have also acted as inflation hedges, holding or gaining value when rising prices erode equity and bond returns.
CFDs make this accessible. A single account on MT5 gives exposure to both rising and falling commodity trends, long or short, without holding the physical asset.
Knowing which markets trend is one part of the picture. Understanding the principles that govern how trend systems exploit those moves is the other.
Core Principles of Trend Following
Trend following is built on three principles: price is the only signal that matters, losses are cut quickly, and winning trades are held as long as the trend continues.
Price Is the Primary Signal
In trend following, price is the only input that matters because it reflects all available information about supply, demand, and market sentiment in real time.
Trend following doesn't require knowing why a commodity is moving. A supply shock, a geopolitical event, a sentiment shift - the cause is irrelevant to the trading decision. What matters is that price is moving in a direction, and that direction has a measurable tendency to continue.
This isn't just a heuristic. Research by Brian Hurst, Yao Hua Ooi, and Lasse Pedersen at AQR Capital Management, covering commodity prices from 1880 to 2016, found statistically significant autocorrelation: yesterday's price direction predicts tomorrow's better than random chance. Their Century of Evidence study produced a 0.4 Sharpe ratio across every decade in the dataset. Price carries its own signal.
The mechanical logic is straightforward. Price trends up, you go long. Price trends down, you go short.
No earnings reports, no macro forecasts, no commodity supply models required.
On MT5, instruments like XAUUSD (gold), XAGUSD (silver), and Oil let you act on price direction without owning the physical commodity. You're trading the move, not the asset.
Cut Losses Early, Let Profits Run
Most trend following systems win fewer than half their trades. That only works if the winners are large enough to cover all the small losses combined and still leave profit. That's the entire case for cutting losses fast and staying in winners long.
Cutting losses fast keeps the losers small. Letting winners run gives the profitable trades room to grow large enough to offset everything else.
The math only holds if winning trades generate enough to cover all the small losses combined, with profit left over. A string of 6 losses at $50 each means nothing if the next winner runs to $500. Cut that winner early, and the whole model breaks down.
Stop-loss orders are the primary tool for enforcing early exits. You place a stop at a defined level when you open a trade, and if price reverses past that point, the position closes automatically. MT5 handles this mechanically, so discipline doesn't depend on being at your screen.
Leverage makes strict stops more important, not less. A 100:1 leveraged Oil position turns a move that looks small on a chart into a meaningful hit on your account equity. The stop-loss doesn't change that math. It just limits how far the damage goes.
Risk note: a 1% adverse move on a $10,000 position equals a $100 loss - your entire margin deposit at 100:1. Leverage doesn't change how far prices can move. It changes how much of that move you absorb.
Position Sizing as a Risk Control
Position sizing in trend following is scaling trade size inversely to market volatility so each position carries roughly equal risk to the portfolio.
When a commodity is moving sharply, you reduce lot size so the potential dollar loss stays the same across every trade. Volatility goes up, size goes down.
With leverage up to 1:500 available on MT5, a $10,000 position can be controlled with as little as $20 margin at maximum leverage - or $100 at 100:1. During a volatile crude oil move, even a small miscalculation in lot size can blow through a risk budget in minutes. The leverage amplifies both gains and the cost of getting it wrong.
Stronger trends can justify slightly larger allocations, but volatility sets the ceiling. Size up only when price movement is consistent, not when it's erratic.
At a portfolio level, the goal is to equalize risk across every open position so no single commodity dominates your total exposure. A gold trade and a crude oil trade should carry roughly the same dollar risk, even though gold and oil move at different speeds and ranges.
The table below shows how position size adjusts to keep dollar risk constant as volatility changes. Both scenarios target a $250 maximum loss on UKOIL (1 lot = 1,000 barrels):
| Scenario | UKOIL ATR | Stop (2x ATR) | Risk per lot | Position size ($250 risk) |
|---|---|---|---|---|
| Low volatility period | $1.50 | $3.00 | $3,000 | 0.08 lots |
| High volatility period | $3.50 | $7.00 | $7,000 | 0.04 lots |
When ATR doubles, position size roughly halves. The dollar risk stays the same at $250.
Risk management is a continuous adjustment. As prices move, position sizes need to be rebalanced to keep the risk distribution even across your holdings. A calculation made at entry is outdated the moment the market moves.
Tight spreads reduce the friction cost of holding multiple trend positions at once. On VantoTrade's Raw account, lower entry and exit costs make it practical to run and adjust a multi-commodity portfolio without spread drag eating into the math.
Tools and Indicators Used in Commodity Trend Trading
The core tools in commodity trend trading are moving averages (20, 50, 200-day), Donchian channels, and ATR for volatility measurement.
Moving averages signal trend direction by comparing current price to the average price over a set period. Price above the MA is bullish; price below is bearish.
Three periods are standard:
-
20-day - short-term trend direction
-
50-day - medium-term momentum
-
200-day - the long-term trend benchmark most traders use to define the primary trend
When the 50-day crosses above the 200-day, that's a crossover signal. It confirms a trend is already established, not that one is starting. All three MAs are built into MT5 as standard indicators.
| Instrument | Symbol | Contract Size | Active Session (GMT) |
|---|---|---|---|
| Gold | XAUUSD | 100 troy oz | 13:00-17:00 (London-NY overlap) |
| Silver | XAGUSD | 5,000 troy oz | 13:00-17:00 (London-NY overlap) |
| Brent Crude | UKOIL | 1,000 barrels | 14:00-20:00 (US session) |
Donchian channels plot the highest high and lowest low over a lookback period, commonly 20 days. The result is a price channel with an upper and lower band.
A close above the upper band signals a new 20-day high, treated as a bullish breakout. A close below the lower band signals a new 20-day low. This is one of the oldest systematic trend signals in commodity trading, used by trend-following funds for decades.
For example, if XAUUSD traded between $4,850 and $5,100 over the past 20 sessions, the upper Donchian band sits at $5,100 and the lower at $4,850. A daily close above $5,100 signals a breakout long entry. A close below $4,850 signals a short. The channel updates each day as old highs and lows roll off the 20-day window.
Volatility estimation is what Average True Range (ATR) is built for. It measures the average daily price range over 14 days, giving a practical stop-distance input in actual price terms.
ATR is used to set stop distances and calibrate position sizes, not to predict direction. A wider ATR means larger price swings, so stops need more room and position sizes come down.
For example, if XAUUSD has a 14-day ATR of $55, a 2x ATR stop sits $110 from entry. You can check current ATR values directly in MT5's indicator panel by adding the ATR indicator to any chart.
All three tools serve the same purpose: confirming trend direction and current volatility. None of them predict what price will do next. For more on how these indicators apply to commodity CFDs, see commodity technical analysis.
What these tools do is define conditions. A rules-based system then decides what to do when those conditions are met.
How a Basic Trend Following System Works
A basic trend following system identifies price trends using technical indicators, then applies strict rules for entering positions in the trend direction, exiting when the trend reverses, and sizing positions relative to market volatility and risk allocation.
Trend following systems are fully rules-based. Every entry, exit, and position size is determined by predefined rules, with no discretionary judgment involved.
The same rules run across many markets at the same time. When a trend appears, the system takes a long position in rising markets and a short position in falling ones, following the direction of price movement in either case.
Entry Conditions
Entry rules define the exact conditions a price signal must meet before a trade is opened. These conditions vary by system, but every rule-based approach specifies them in advance.
Two approaches are common in trend following systems:
-
Price breakout: Price moving above a prior high triggers a long position. Price breaking below a prior low triggers a short. This signals that a new trend leg is beginning.
-
12-month momentum rule: If a market's return over the past 12 months is positive, the system enters long. If negative, it enters short.
Many systems add a secondary filter before confirming an entry. A moving average or momentum oscillator checks whether the trend is strong enough to justify opening a position.
Position sizing works as an implicit filter too. Highly volatile markets receive smaller positions, which limits exposure when trend signals are less reliable.
Exit Conditions
Entries get all the attention, but exits determine what you actually keep. A trend following system without defined exit rules is not a system.
Every trend following trade requires a stop-loss set at entry. It defines the maximum you are willing to lose on that position before the trade is wrong.
Two common placement approaches:
-
ATR multiple - place the stop a set number of Average True Range units from entry, so volatility determines the distance
-
Prior swing low/high - place the stop just beyond the last significant price swing, so a break of that level signals the trend has reversed
MT5's built-in stop-loss field enforces this mechanically. The stop is attached to the order and executes automatically if price reaches that level.
Two rules-based approaches for exiting a winner:
-
Signal reversal - if the indicator that triggered the entry flips (for example, a moving average crosses back), the system closes the position. The same logic that opened the trade closes it.
-
Trailing stop - the stop moves in the direction of the trade as price advances, locking in gains while keeping the position open as long as the trend continues. MT5 has a built-in trailing stop tool that updates the stop automatically.
Position Sizing
Calculate position size by dividing your risk amount per trade by the distance to your stop loss, then scale down when volatility is high to keep risk constant across markets.
Trend followers commonly risk 1-2% of account equity per trade, keeping any single loss small relative to the total account.
The standard sizing formula:
Position size (lots) = (Account equity x risk%) / (stop distance in $ x contract value per lot)
The table below shows how this formula scales across three account sizes. All examples use UKOIL with a $3.00 stop distance (2x ATR) and a contract value of 1,000 barrels per lot, so each $1 move equals $1,000 per lot:
| Account | Risk (1%) | Stop distance | Risk per lot | Position size |
|---|---|---|---|---|
| $5,000 | $50 | $3.00 | $3,000 | 0.02 lots |
| $10,000 | $100 | $3.00 | $3,000 | 0.03 lots |
| $25,000 | $250 | $3.00 | $3,000 | 0.08 lots |
On a $5,000 account risking 1%, the maximum loss is $50. Dividing $50 by $3,000 risk per lot gives 0.017, rounded down to 0.02 lots (20 barrels). This is an educational framework, not a recommendation for any individual trader.
When volatility rises, the ATR-based stop distance widens. If lot size stays the same, dollar risk grows. The fix: reduce lot size when volatility increases so the dollar risk per trade stays constant.
Institutional trend followers call this volatility-targeting. Rather than deploying a fixed dollar amount per position, they scale lot size based on the current risk level of the instrument.
As a concrete illustration, at 100:1 leverage $100 in margin controls a $10,000 position. A lot size error that looks small on paper translates into a much larger capital exposure.
VantoTrade offers up to 1:500 leverage on commodities. At any leverage level, the same sizing discipline applies: calculate risk in dollars before placing the order, not after.
Risk warning: leverage magnifies both gains and losses. This is especially relevant in volatile commodity markets like oil, where prices can move sharply during economic announcements.
For a broader framework on measuring and managing commodity exposure, see commodities risk analysis.
Why Beginners Struggle With Trend Following
Trend following works on paper. Living through it is harder.
A 30% win rate means 7 losses for every 3 winners. That's not a bad streak - that's how the system is designed to work.
The math holds up because winners are large and losers are small. But when you're 4 or 5 losses deep in a row, that logic feels distant. Beginners often quit here, convinced the system is broken. VantoTrade's demo account lets you experience those drawdown sequences without real capital on the line, so the emotional pattern becomes familiar before money is at risk.
Trend following losses cluster in one specific condition: sideways, choppy markets. Price moves back and forth without committing to a direction, and every signal turns into a false start.
Patience is the skill that keeps a trader in the game during these periods. MT5 price alerts let you set a notification for when price moves decisively, so you can step away from the screen instead of reacting to noise. Watching every candle in a consolidation zone is how discipline breaks down.
Pre-defined rules remove the hardest part of losing streaks: in-trade decisions. When entries, exits, and position sizes are set in advance, there's nothing to debate mid-trade.
Backtesting builds the conviction to hold those rules. MT5's historical chart data lets you walk through past drawdown periods manually, trade by trade, and see how the strategy recovered. Watching a system survive a 10-loss run and still finish ahead is more persuasive than any rule written on paper.
Common mistake: increasing position size after a winning streak because gains feel like 'house money.' The strategy's edge doesn't change after a good run - but over-sizing during a subsequent drawdown can erase weeks of progress quickly.
What Time Frame Works Best?
Most commodity trend followers use daily or weekly charts, covering holding periods from weeks to months, to capture sustained macro-driven price moves.
Commodity prices move on forces like OPEC decisions, crop reports, and currency shifts. These unfold over weeks or months, not hours.
On a 5-minute chart, most of that movement looks like noise. Intraday signals fire constantly, but few align with the actual trend.
More signals mean more trades, and more trades mean more spread and commission costs. On commodities, those costs add up fast.
Execution quality matters too. Even with VantoTrade's sub-28ms execution, slippage is a real factor during news events on instruments like crude oil. Short time frames compress your margin for error.
Shorter time frames also amplify transaction costs. More signals mean more entries, and each entry adds spread cost. On VantoTrade's Raw account, spreads from 0.0 pips reduce this friction, but the compounding effect of frequent entries on any time frame is still worth factoring into your expected edge.
Trend followers work across a full speed spectrum, from hourly systems to multi-year position holders.
H1 and H4 suit commodities around scheduled news events, like natural gas storage reports or crude oil inventory data. Moves can be sharp and fast. Tighter stops are essential, and drawdowns are shallower but more frequent. Both time frames are available on MT5 through VantoTrade.
D1 is where most macro-driven commodity trends become visible. A lot of the big moves in gold, oil, and agricultural commodities are built on daily chart structure. MT5 on VantoTrade includes D1 as a standard chart interval.
Weekly and monthly charts are where institutional managed futures funds operate. Fewer trades per year, larger per-trade gains, and longer drawdown periods. Commodity trends historically persist long enough to justify the holding cost at this pace.
Apply Commodity Trend Strategies With VantoTrade's Raw Spreads and 1:500 Leverage
Trend strategies on commodities depend on tight entry costs, fast fills, and available leverage. Execution conditions determine whether the mechanics work in practice.
VantoTrade's commodity trading conditions:
-
Raw spreads from 0.0 pips on Gold, Silver, and Oil
-
Leverage up to 1:500 on commodity instruments
-
Sub-28ms execution on MT5 via A-Book/STP routing
-
$25 minimum deposit on Standard accounts; $100 minimum on Raw accounts
You can verify spread and fill behavior on live prices through a demo account before committing capital.
Open a demo account to test commodity trades on live prices with no capital at risk. Spread values, execution speed, and leverage availability are visible from the first trade.
Fund when you're ready. Open a Raw account to see the full conditions.
Risk Disclaimer: Commodity CFD trading involves significant risk of loss. Leverage amplifies both gains and losses, and it is possible to lose more than your initial deposit. Past performance of any strategy does not guarantee future results. This article is educational content only and does not constitute financial advice or a recommendation to trade.
Common Questions About Commodity Trend Following
Does Trend Following Really Work?
Trend following is a statistically validated strategy that generates positive risk-adjusted returns by capturing persistent price movements across commodity futures markets.
The longest-running academic evidence comes from AQR Capital Management researchers Hurst, Ooi, and Pedersen. Their Century of Evidence study analyzed 67 markets spanning 1880 to 2016 and found trend following produced positive annualized excess returns in every single decade across that period, with an overall Sharpe ratio of 0.4.
For commodities specifically, a Journal of Banking and Finance study covering 28 commodity markets over 48 years found that moving average and channel breakout strategies delivered positive net returns in 22 of the 28 markets tested. These are published academic findings. Past results from historical data do not guarantee future performance.
How Can You Invest in Commodity Trend Strategies?
The most direct route for retail traders is commodity CFDs. Open an account on MT5, deposit funds, and trade Gold, Oil, or Silver without needing futures contracts or a fund manager.
The most direct way to trade commodity trends as a retail trader is through CFDs on MT5. Open a live account at VantoTrade, deposit from $25 on a Standard account or $100 on a Raw account, and you can go long or short on Gold (XAUUSD), Silver (XAGUSD), and Oil from a single platform. The same entry and exit rules covered in this guide apply directly to those instruments.
Before trading live, use a demo account to practice reading trend signals, placing orders, and sizing positions without risking real capital. When you move to a live account, apply the rules consistently across instruments. Gold, Silver, and Oil each have different volatility profiles, so adjust your position size for each one accordingly.